Challenge
Disconnected files, parameters, and tools made simulation setup and analysis hard to follow.
Fusion Twin is a web platform for nuclear fusion simulations.
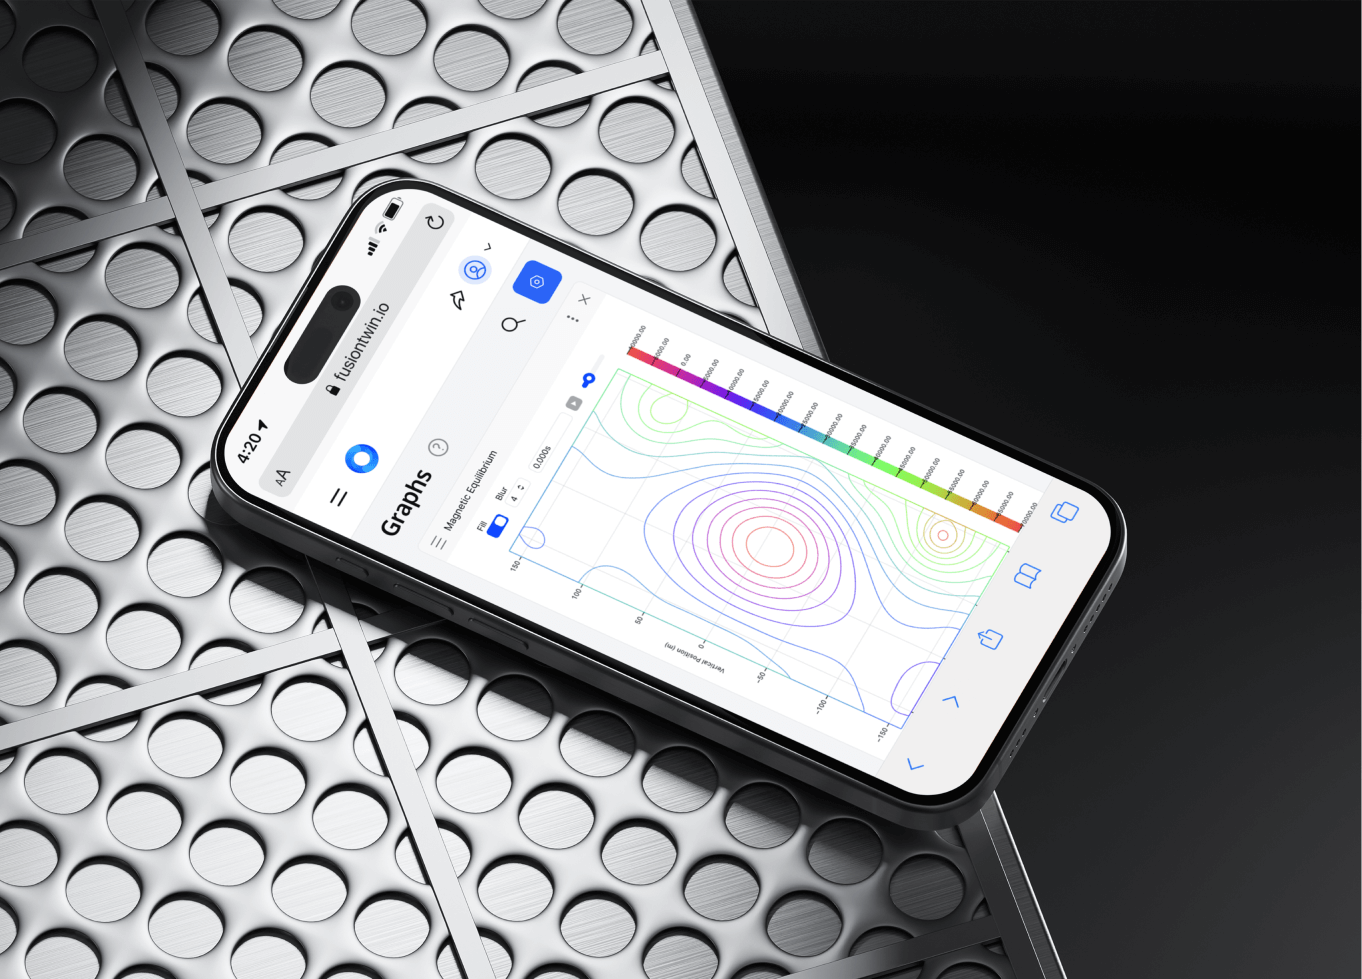
Disconnected files, parameters, and tools made simulation setup and analysis hard to follow.
As the sole Product Designer, I translated scientific requirements into workflows for researchers and students.
I unified file management, simulation setup, status tracking, and results exploration.
Testing showed around 30% better navigation efficiency on selected tasks; browser access removed local installation.
Preparing data, configuring simulations, and exploring results required switching tools. The fragmented workflow raised a question:
How can we bring these steps into one clear experience?
Experienced researchers needed detailed controls, reliable data, and flexibility. Students needed guidance and a safer way to experiment. The challenge was supporting expert work without overwhelming beginners or limiting access to scientific detail.
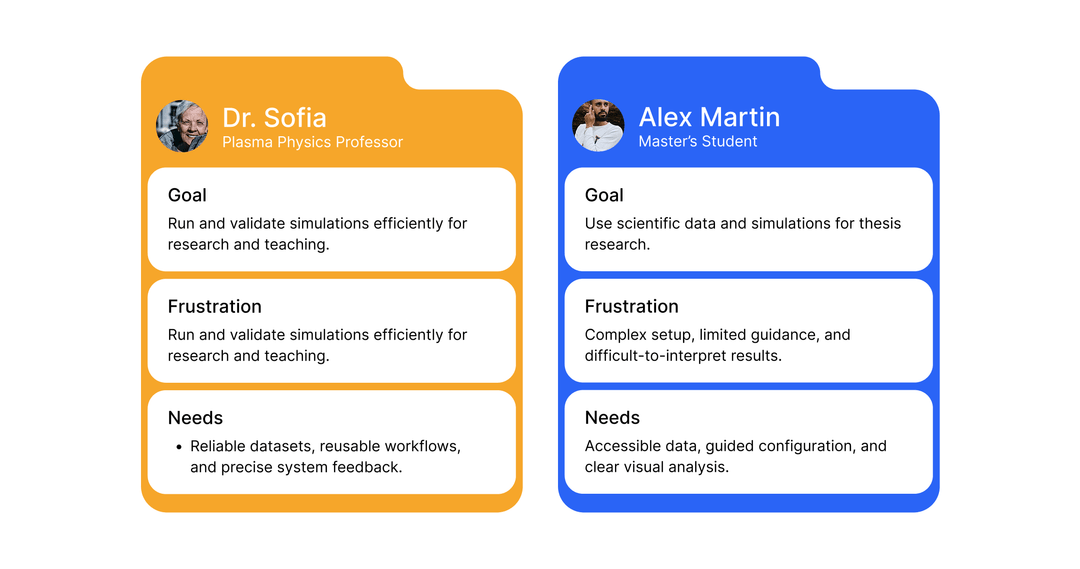
Interviews and workflow analysis revealed:
lengthy setup
disconnected files and simulations
too many steps to compare results
fragmented collaboration.
The opportunity was not to simplify the science.
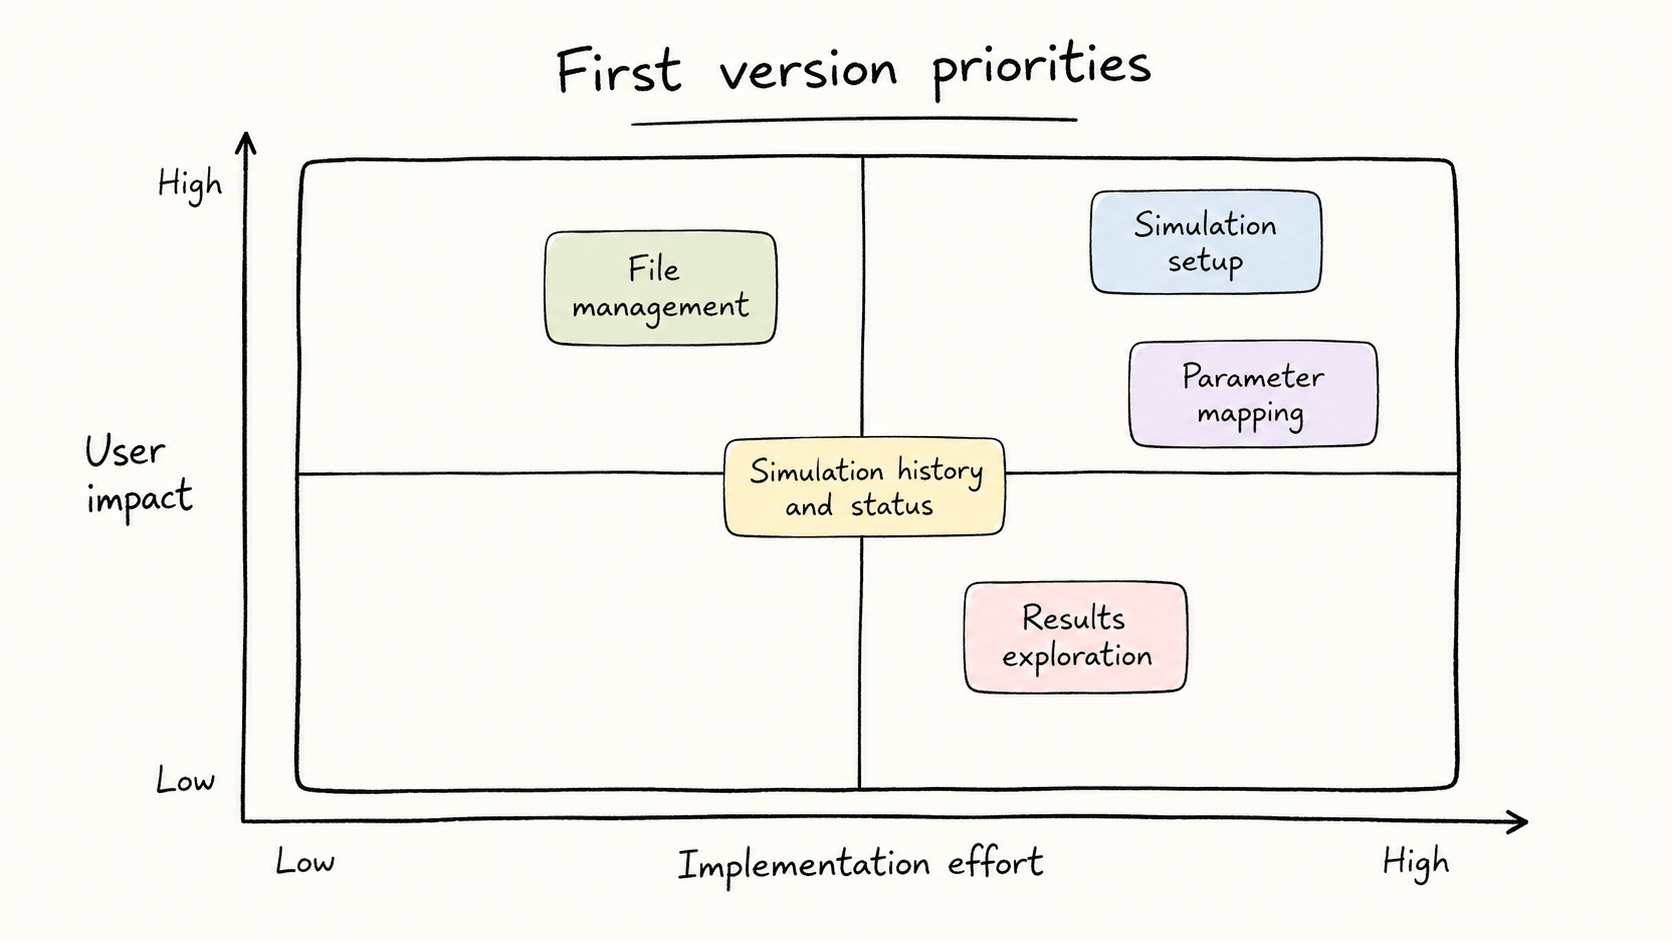
I grouped features around researcher tasks, connecting data, setup, and analysis in a clearer information architecture.
I focused on four core tasks:
managing scientific files
configuring simulations
checking simulation states
understanding results
The resulting priorities:
Early sketches explored layout, hierarchy, and actions before visual detail.
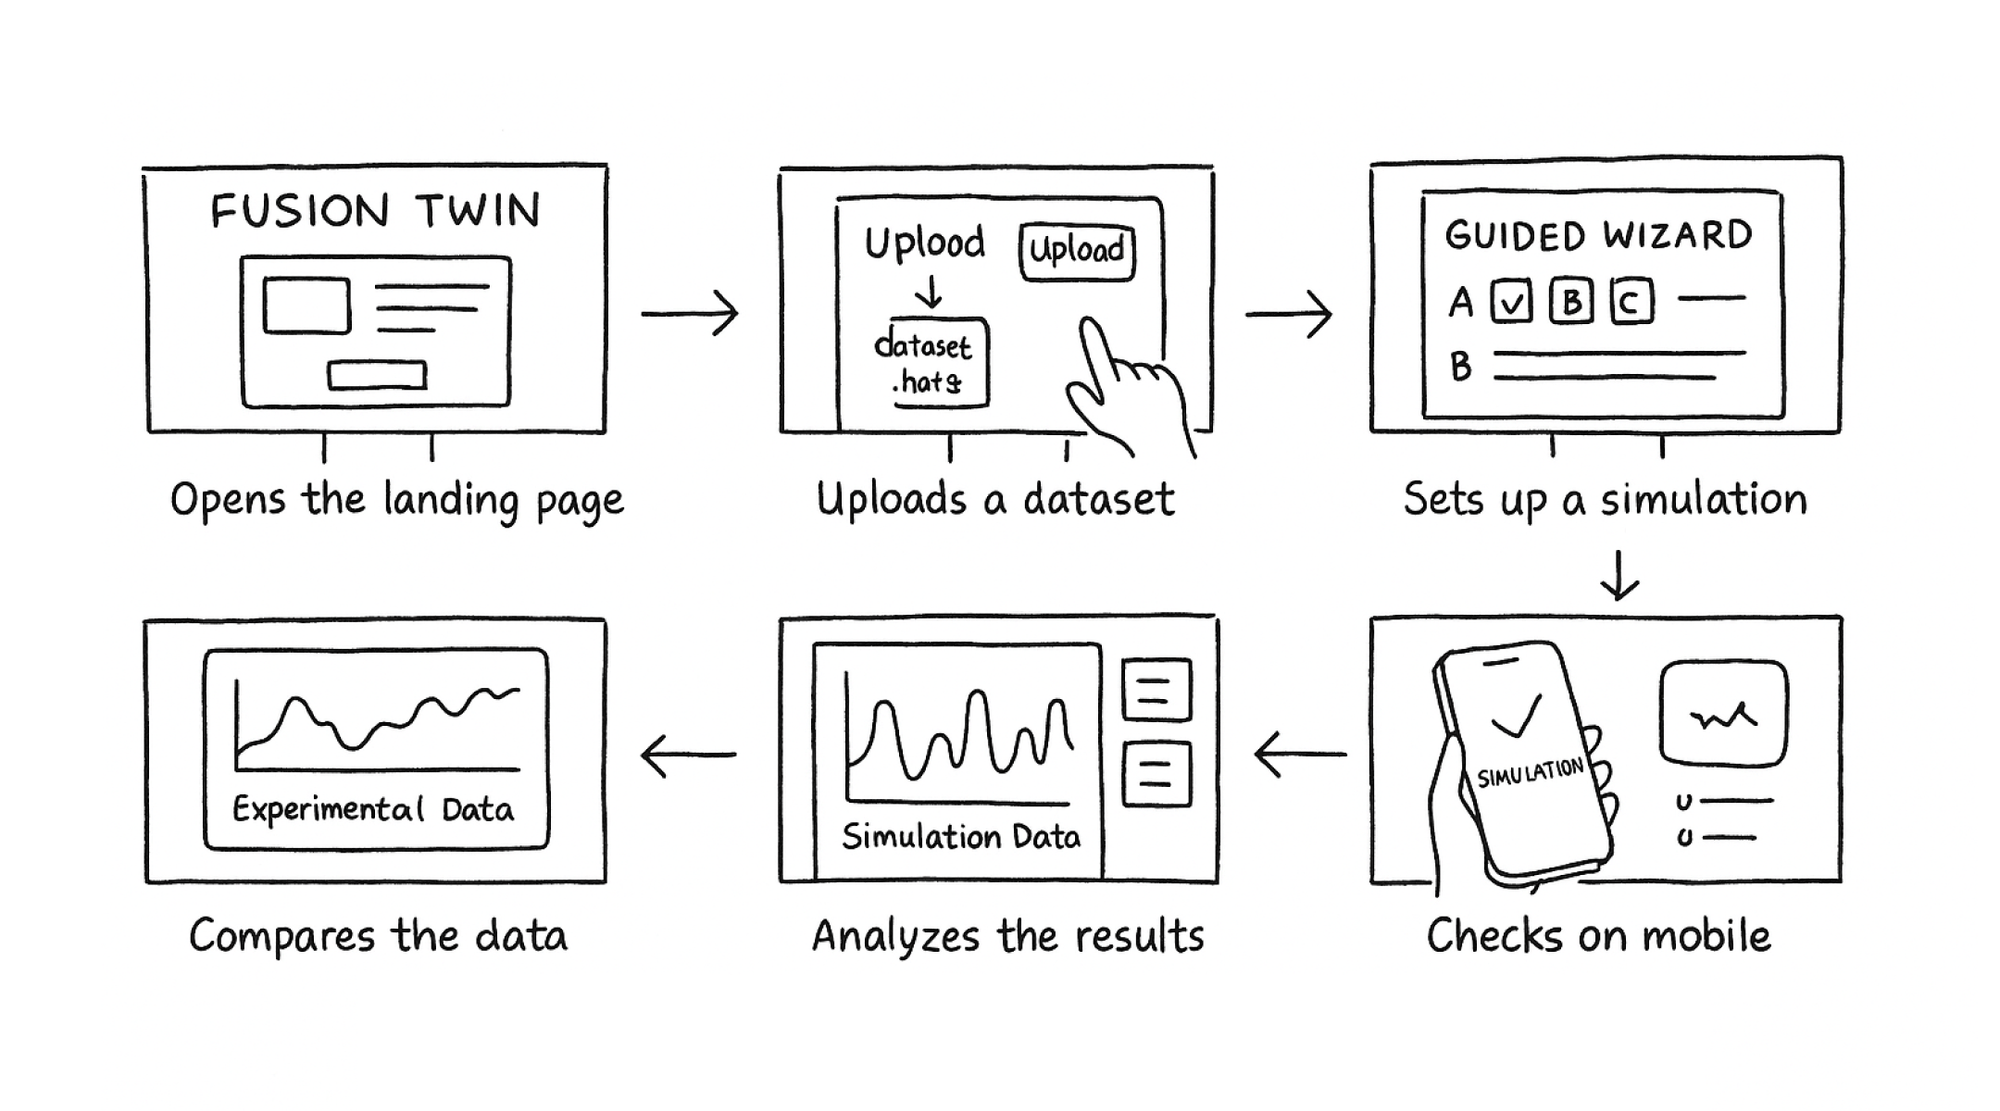
Wireframes tested complex workflows through:
hierarchy
navigation
order of actions
information density
This resolved structural issues before visual design.
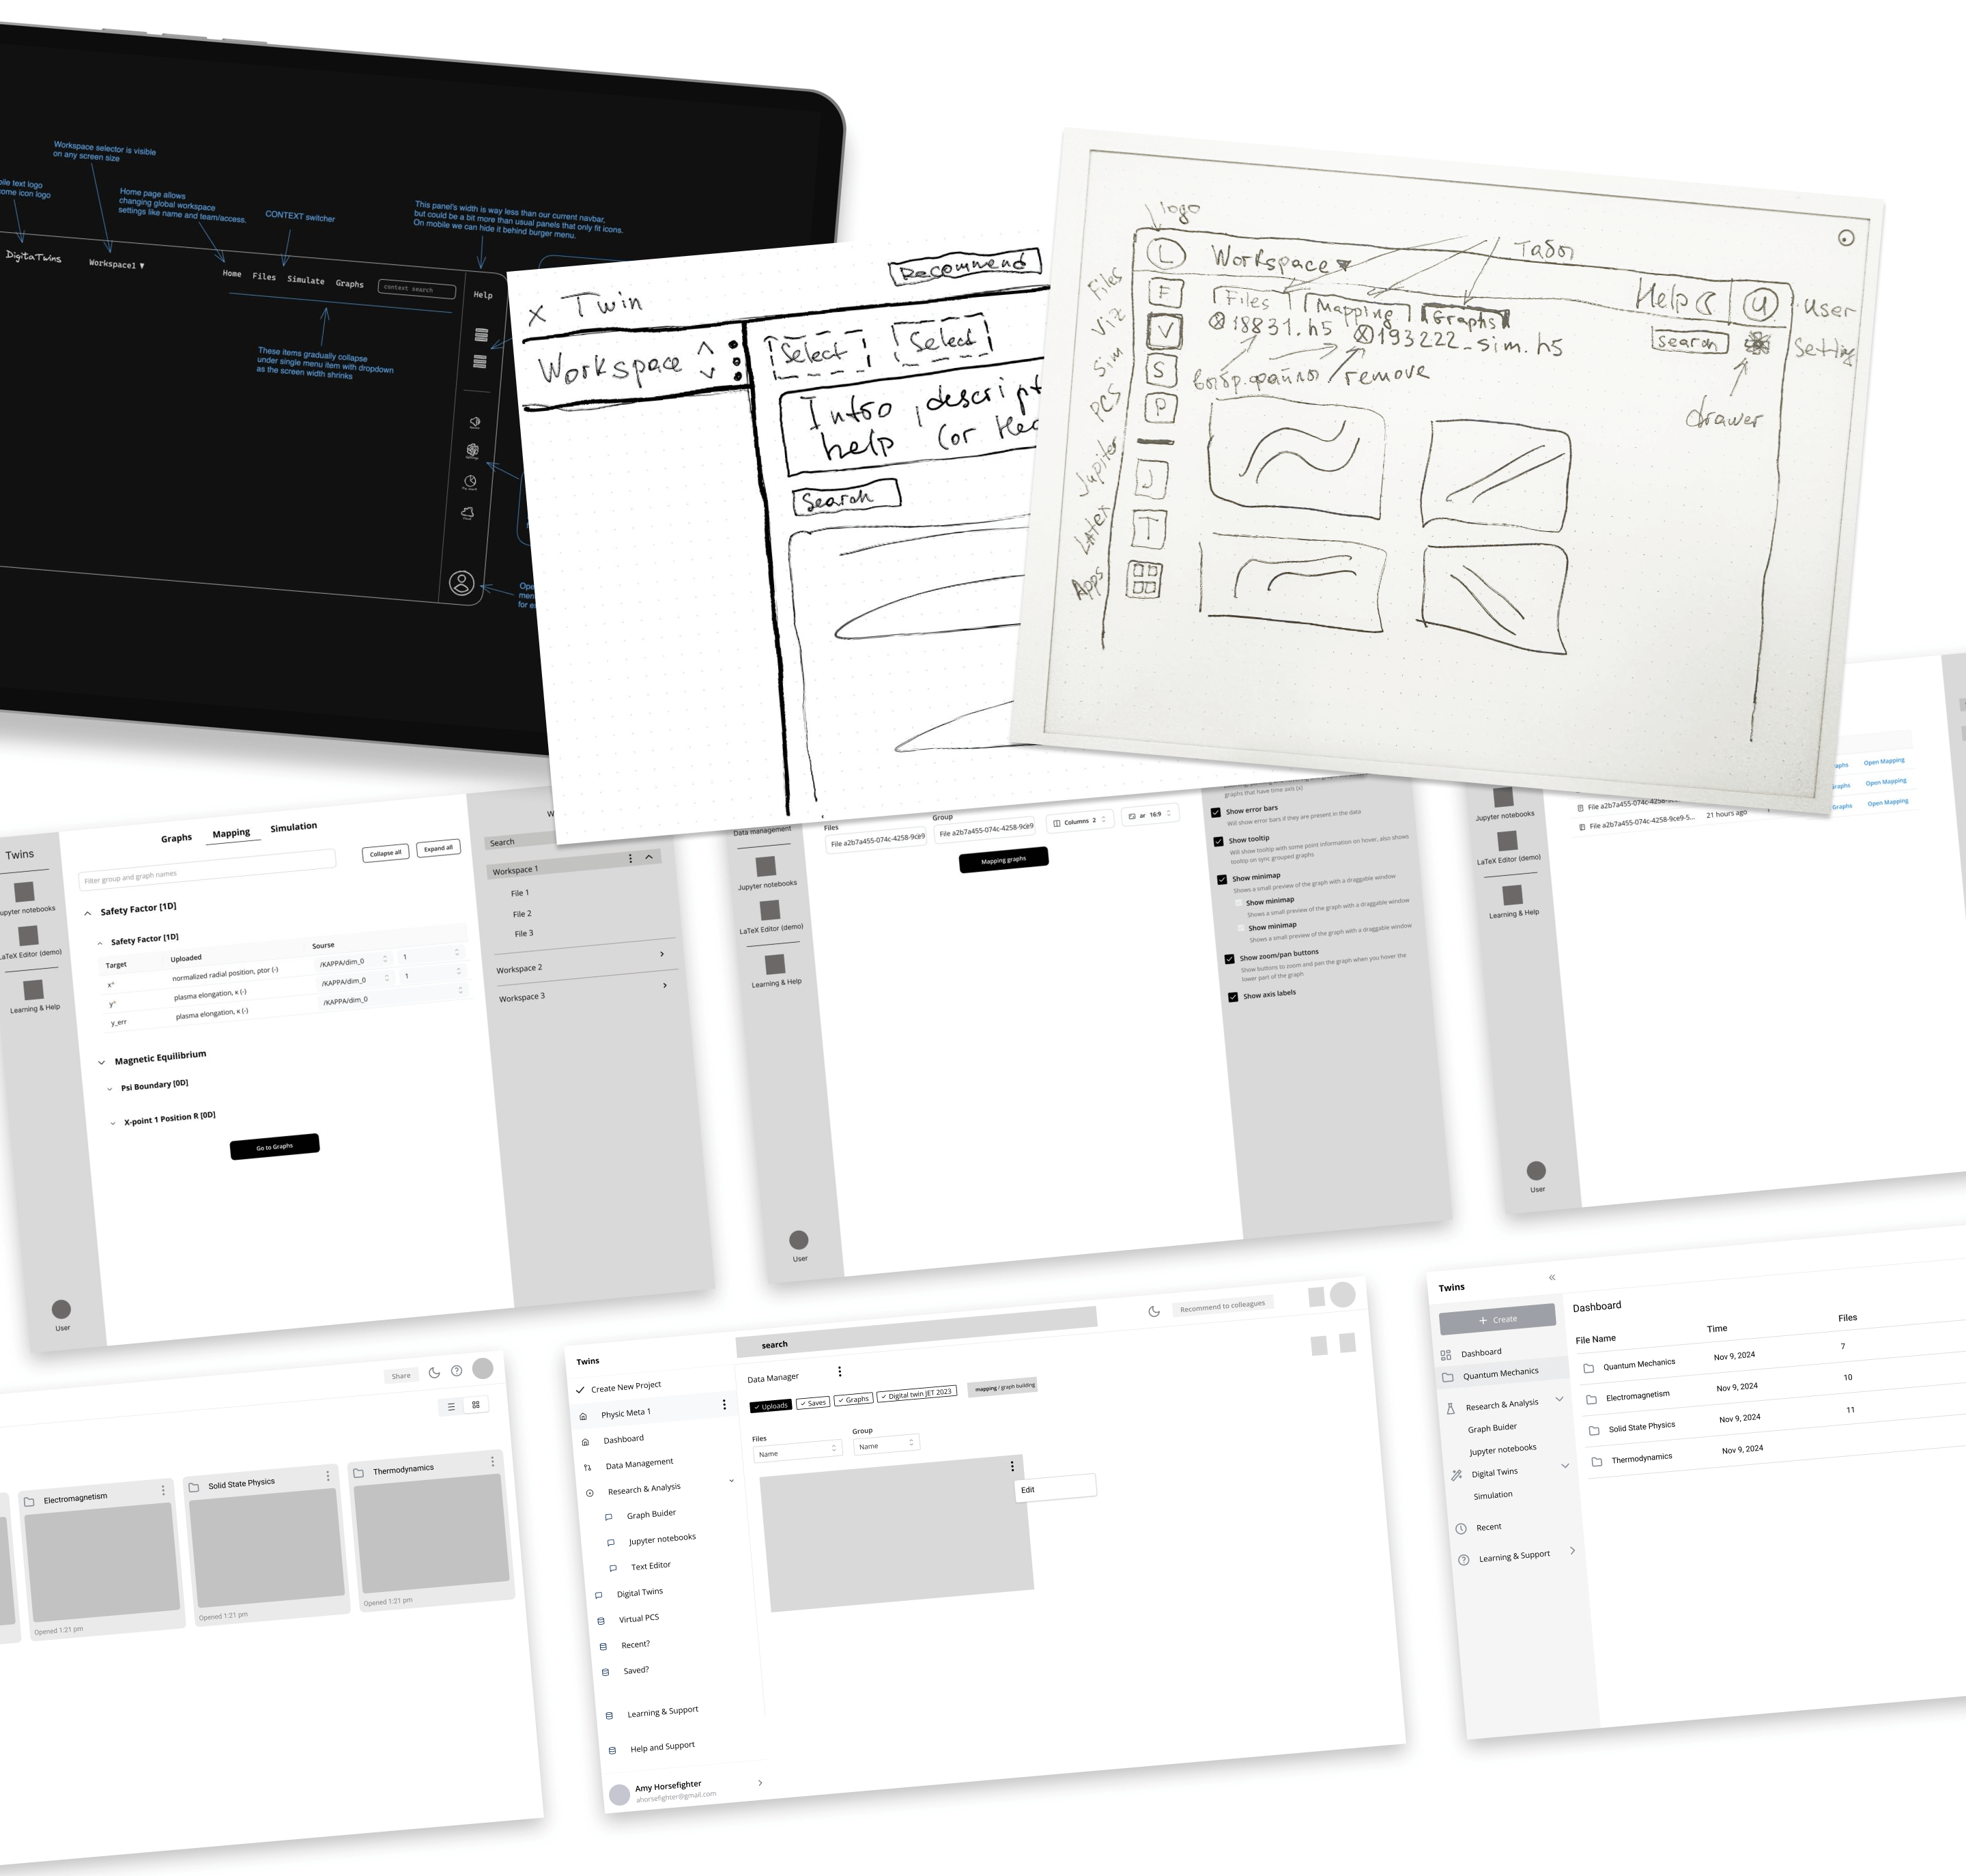
Wireframes validated parameter grouping and system feedback.
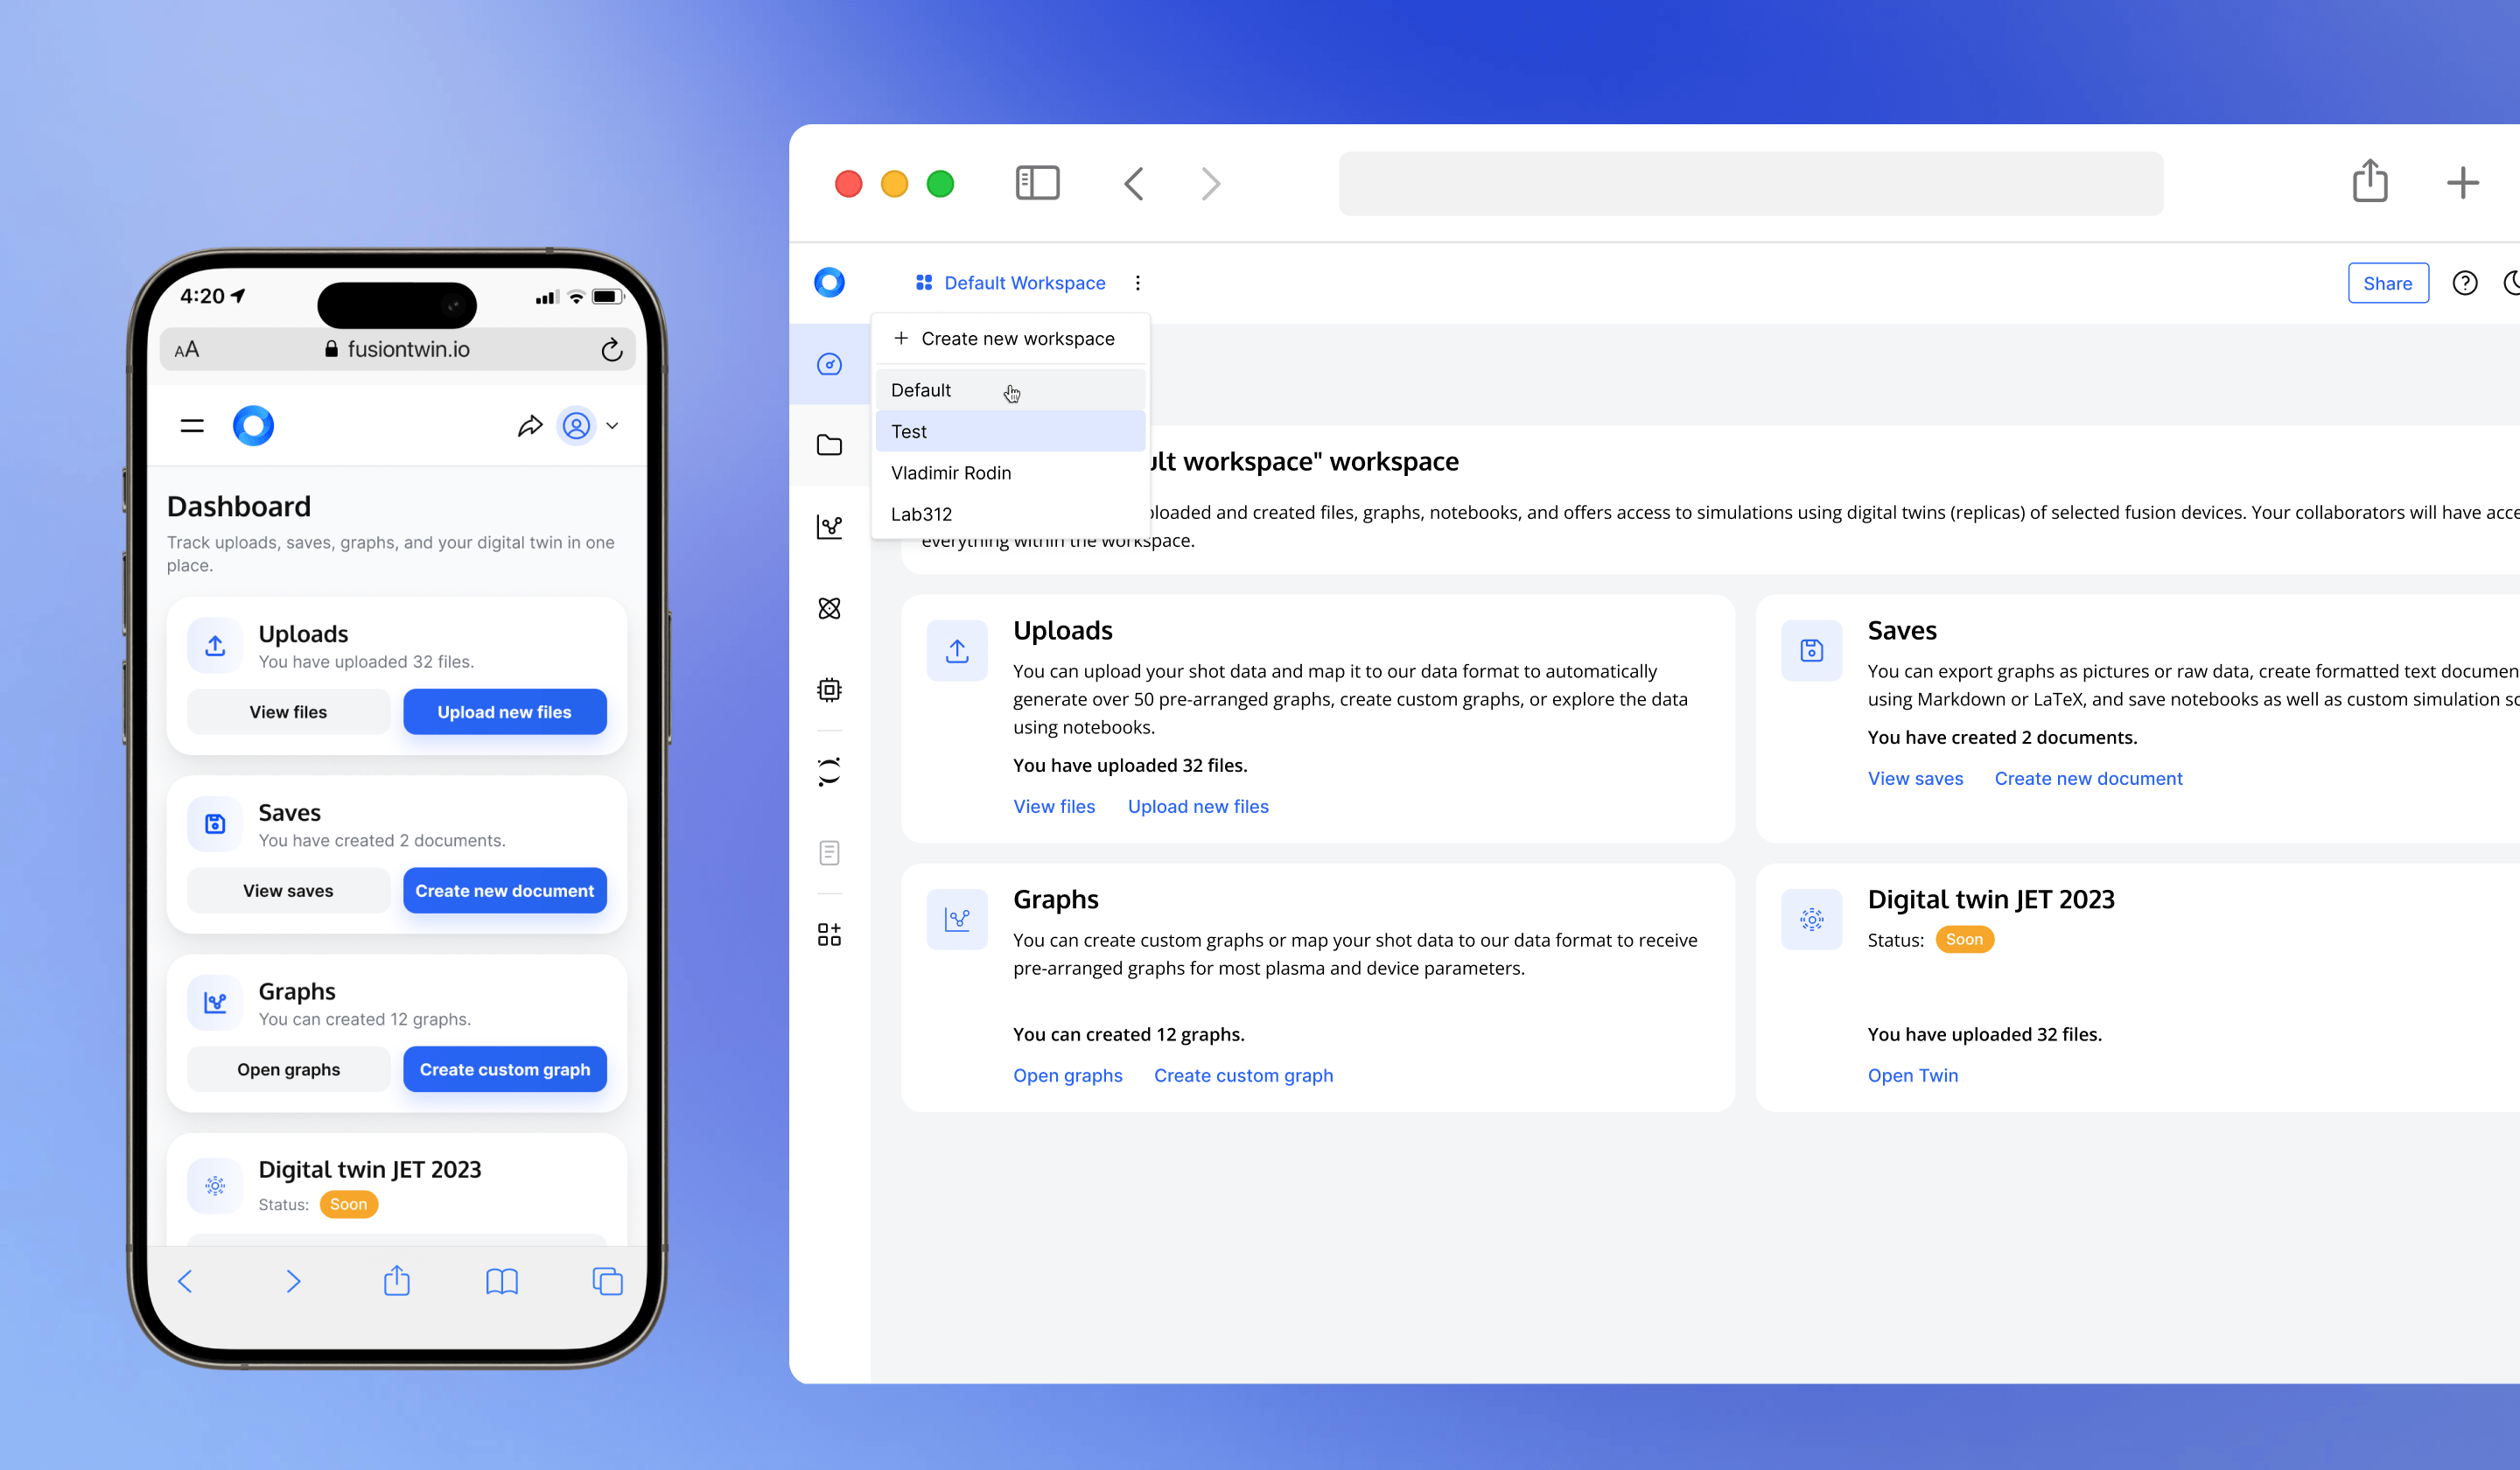
The dashboard brings files, simulations, saved outputs, and visualizations together, making current work visible at a glance.
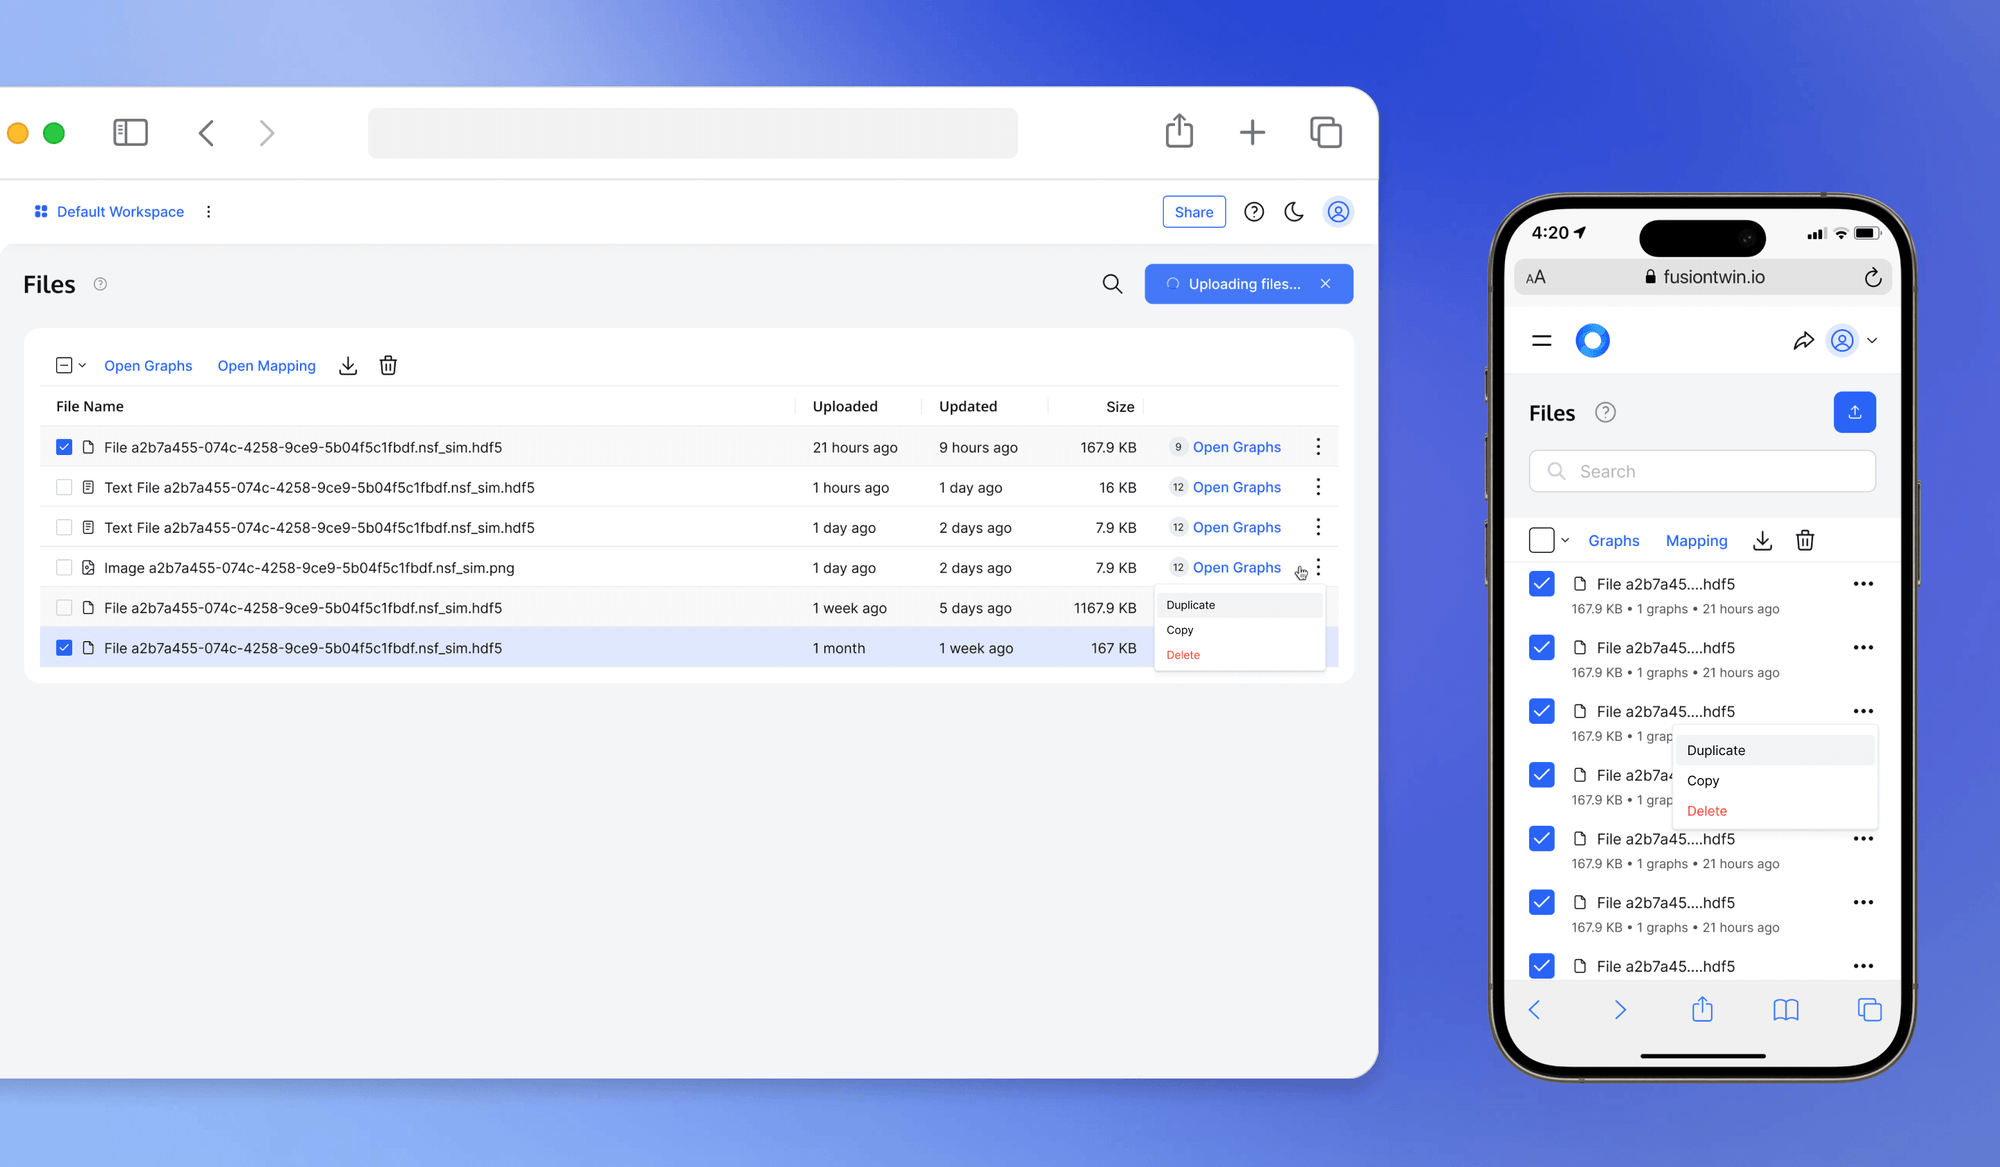
Researchers work with complex datasets, including HDF5 files. I designed one workspace to upload, organize, inspect, and reuse data across simulations, bringing file management into the product instead of leaving it outside the workflow.
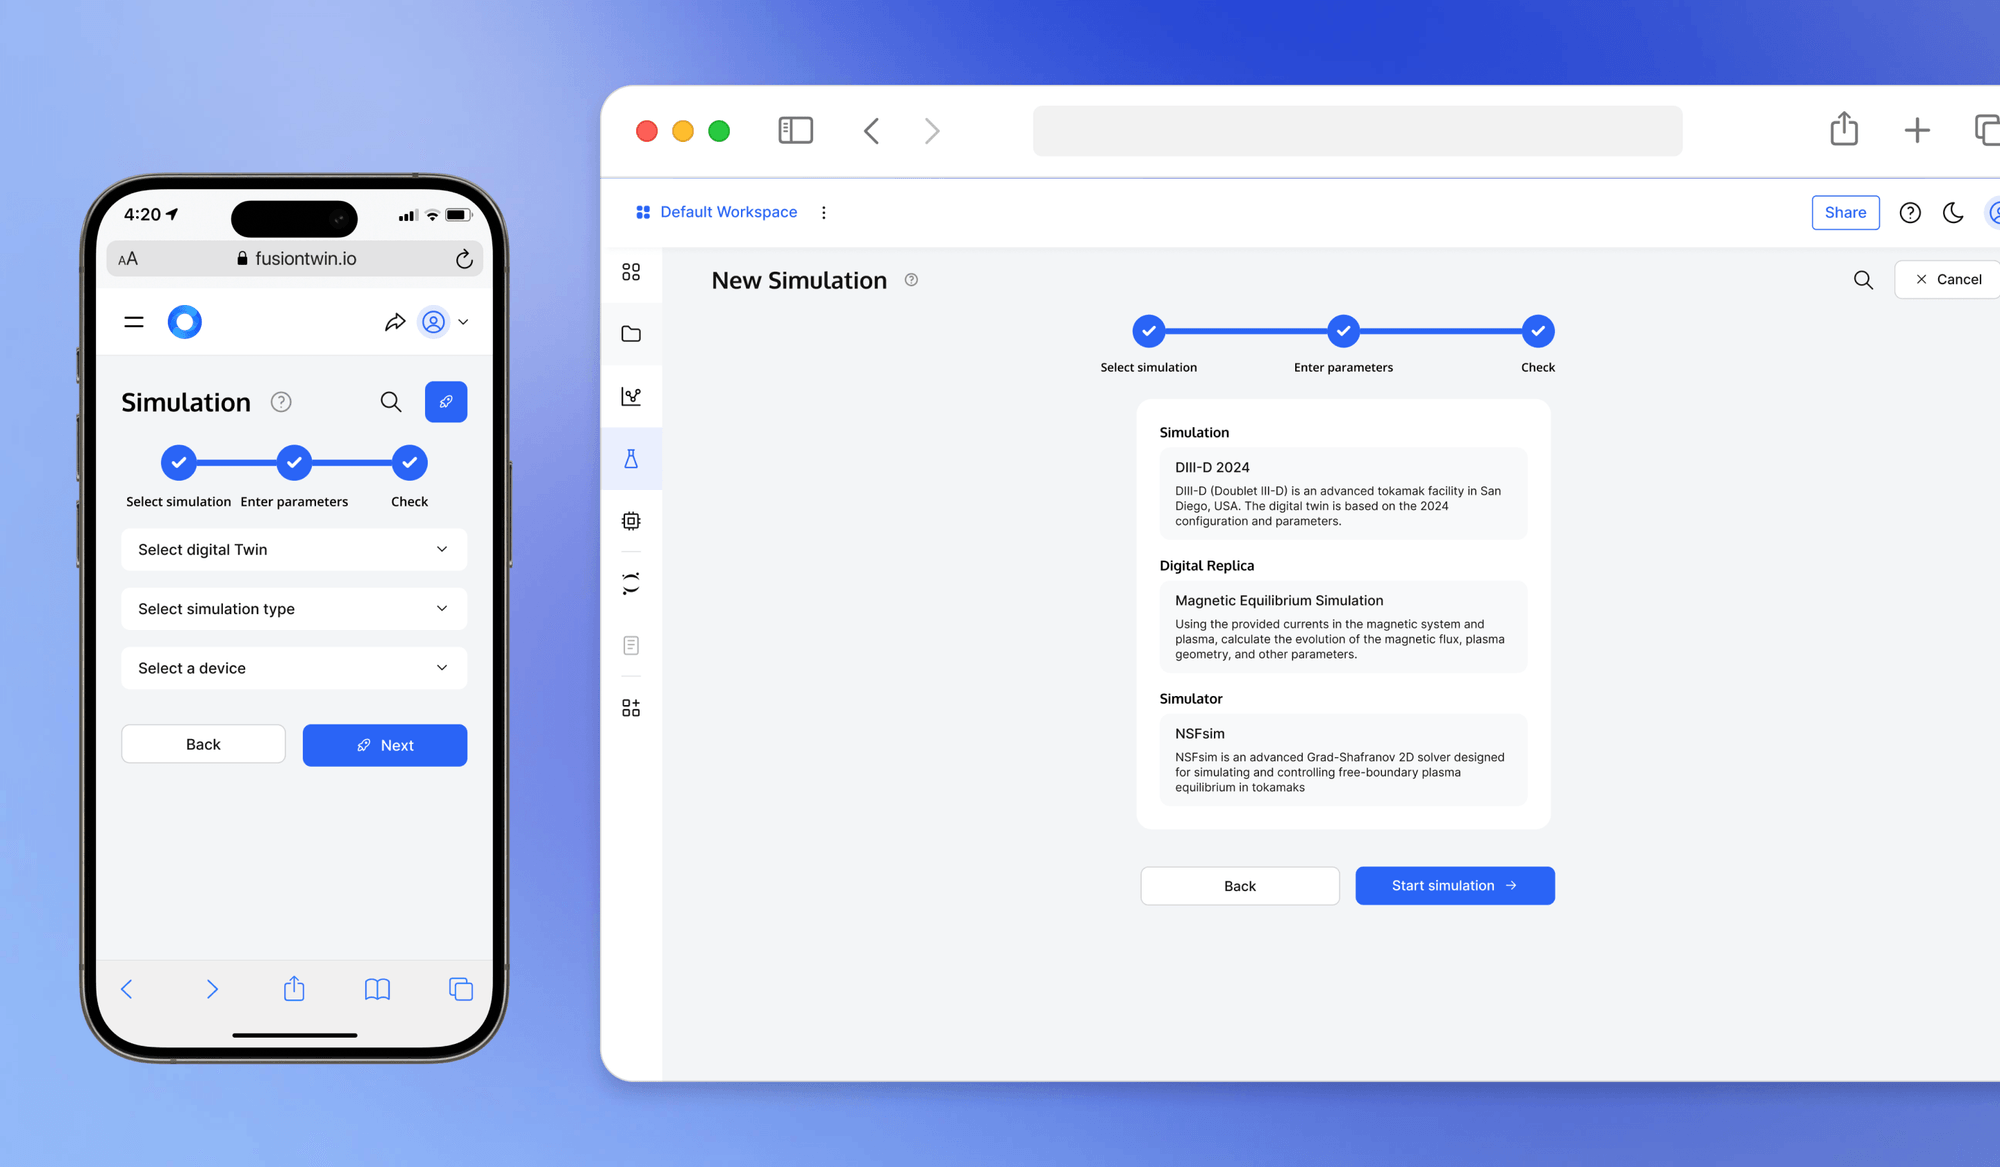
Simulation setup involves many parameters and technical decisions. I designed a guided sequence that makes required steps clear to beginners while keeping advanced controls available to experts. This balanced guidance with the flexibility scientific work demands.
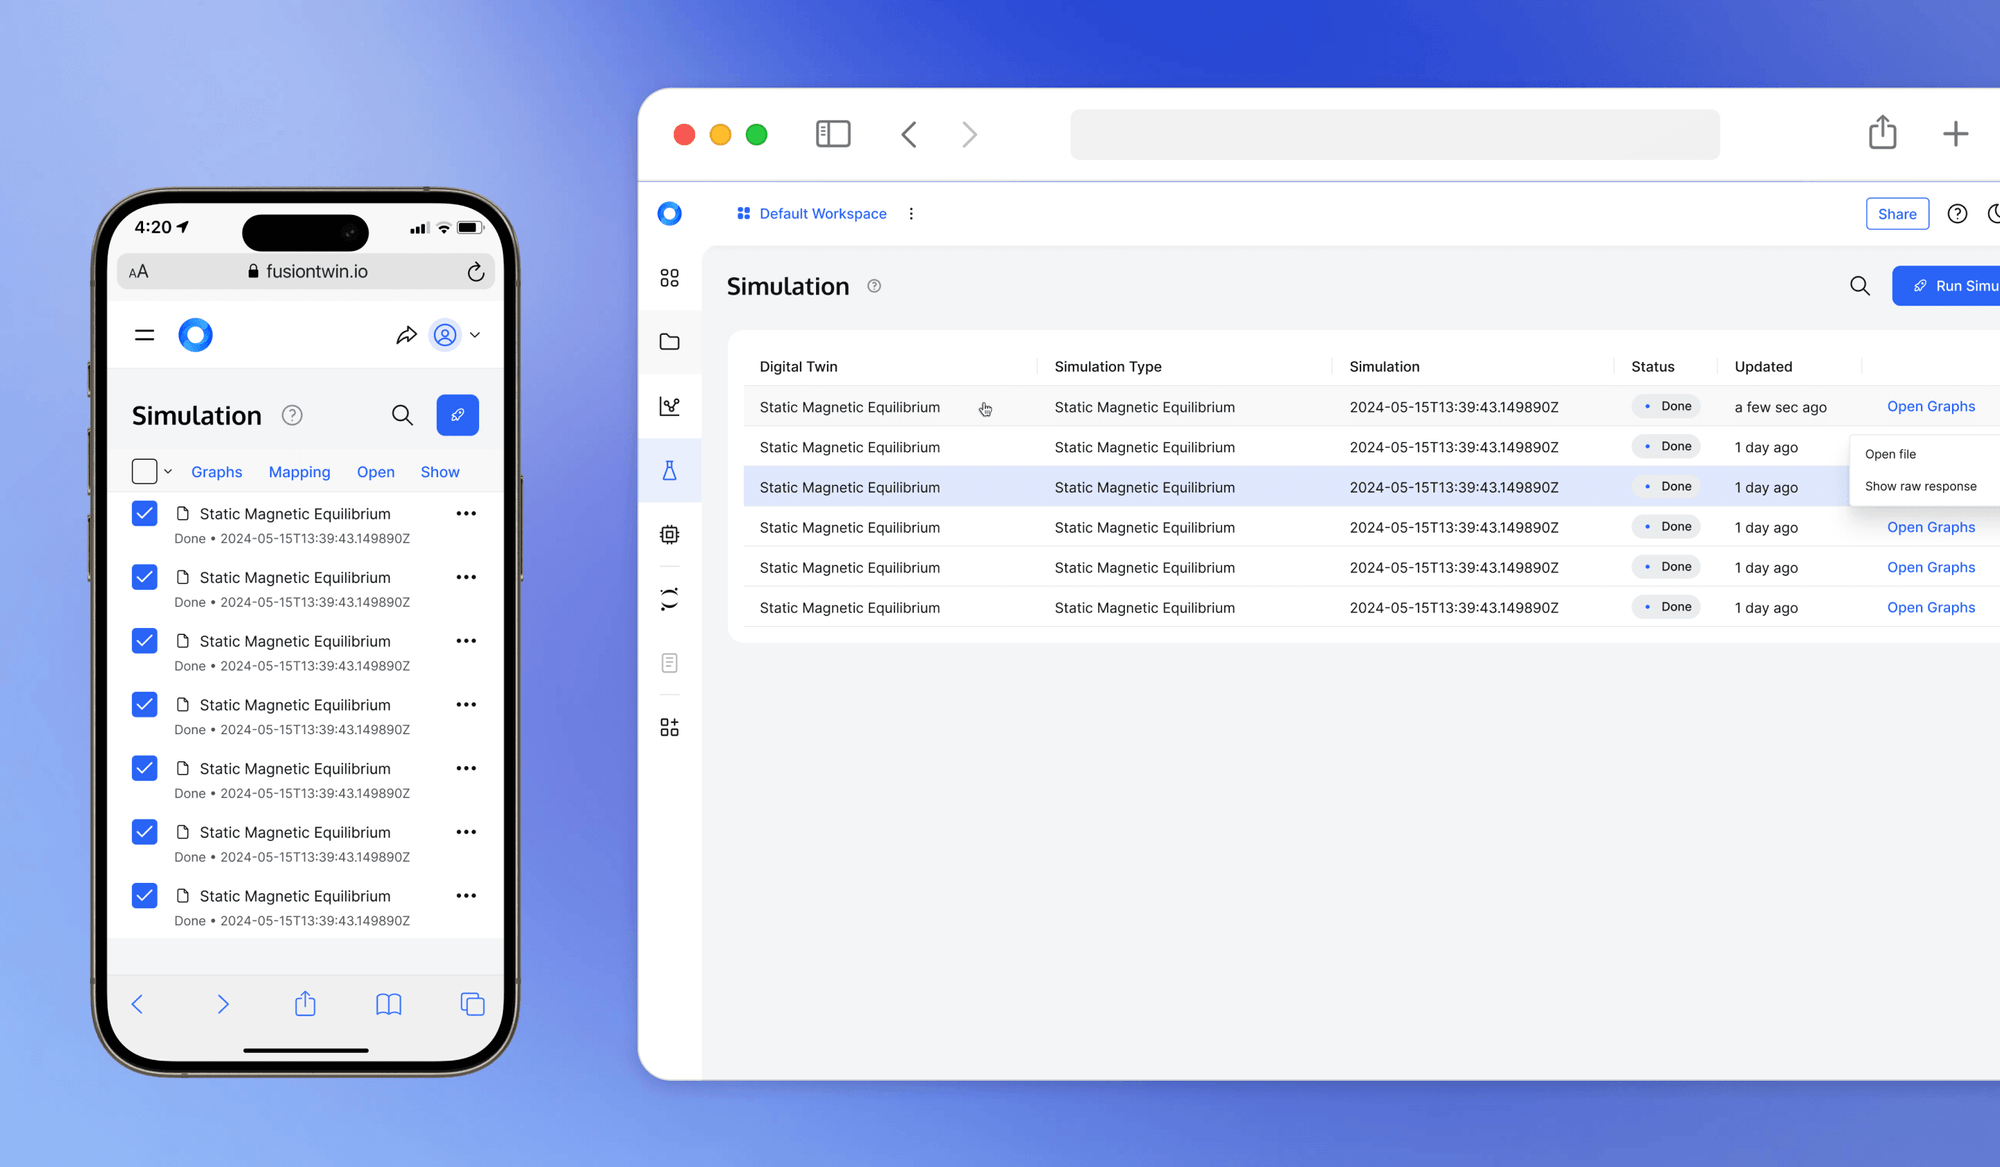
Researchers needed to track simultaneous simulations by state:
Clear states let users track progress without opening each simulation.
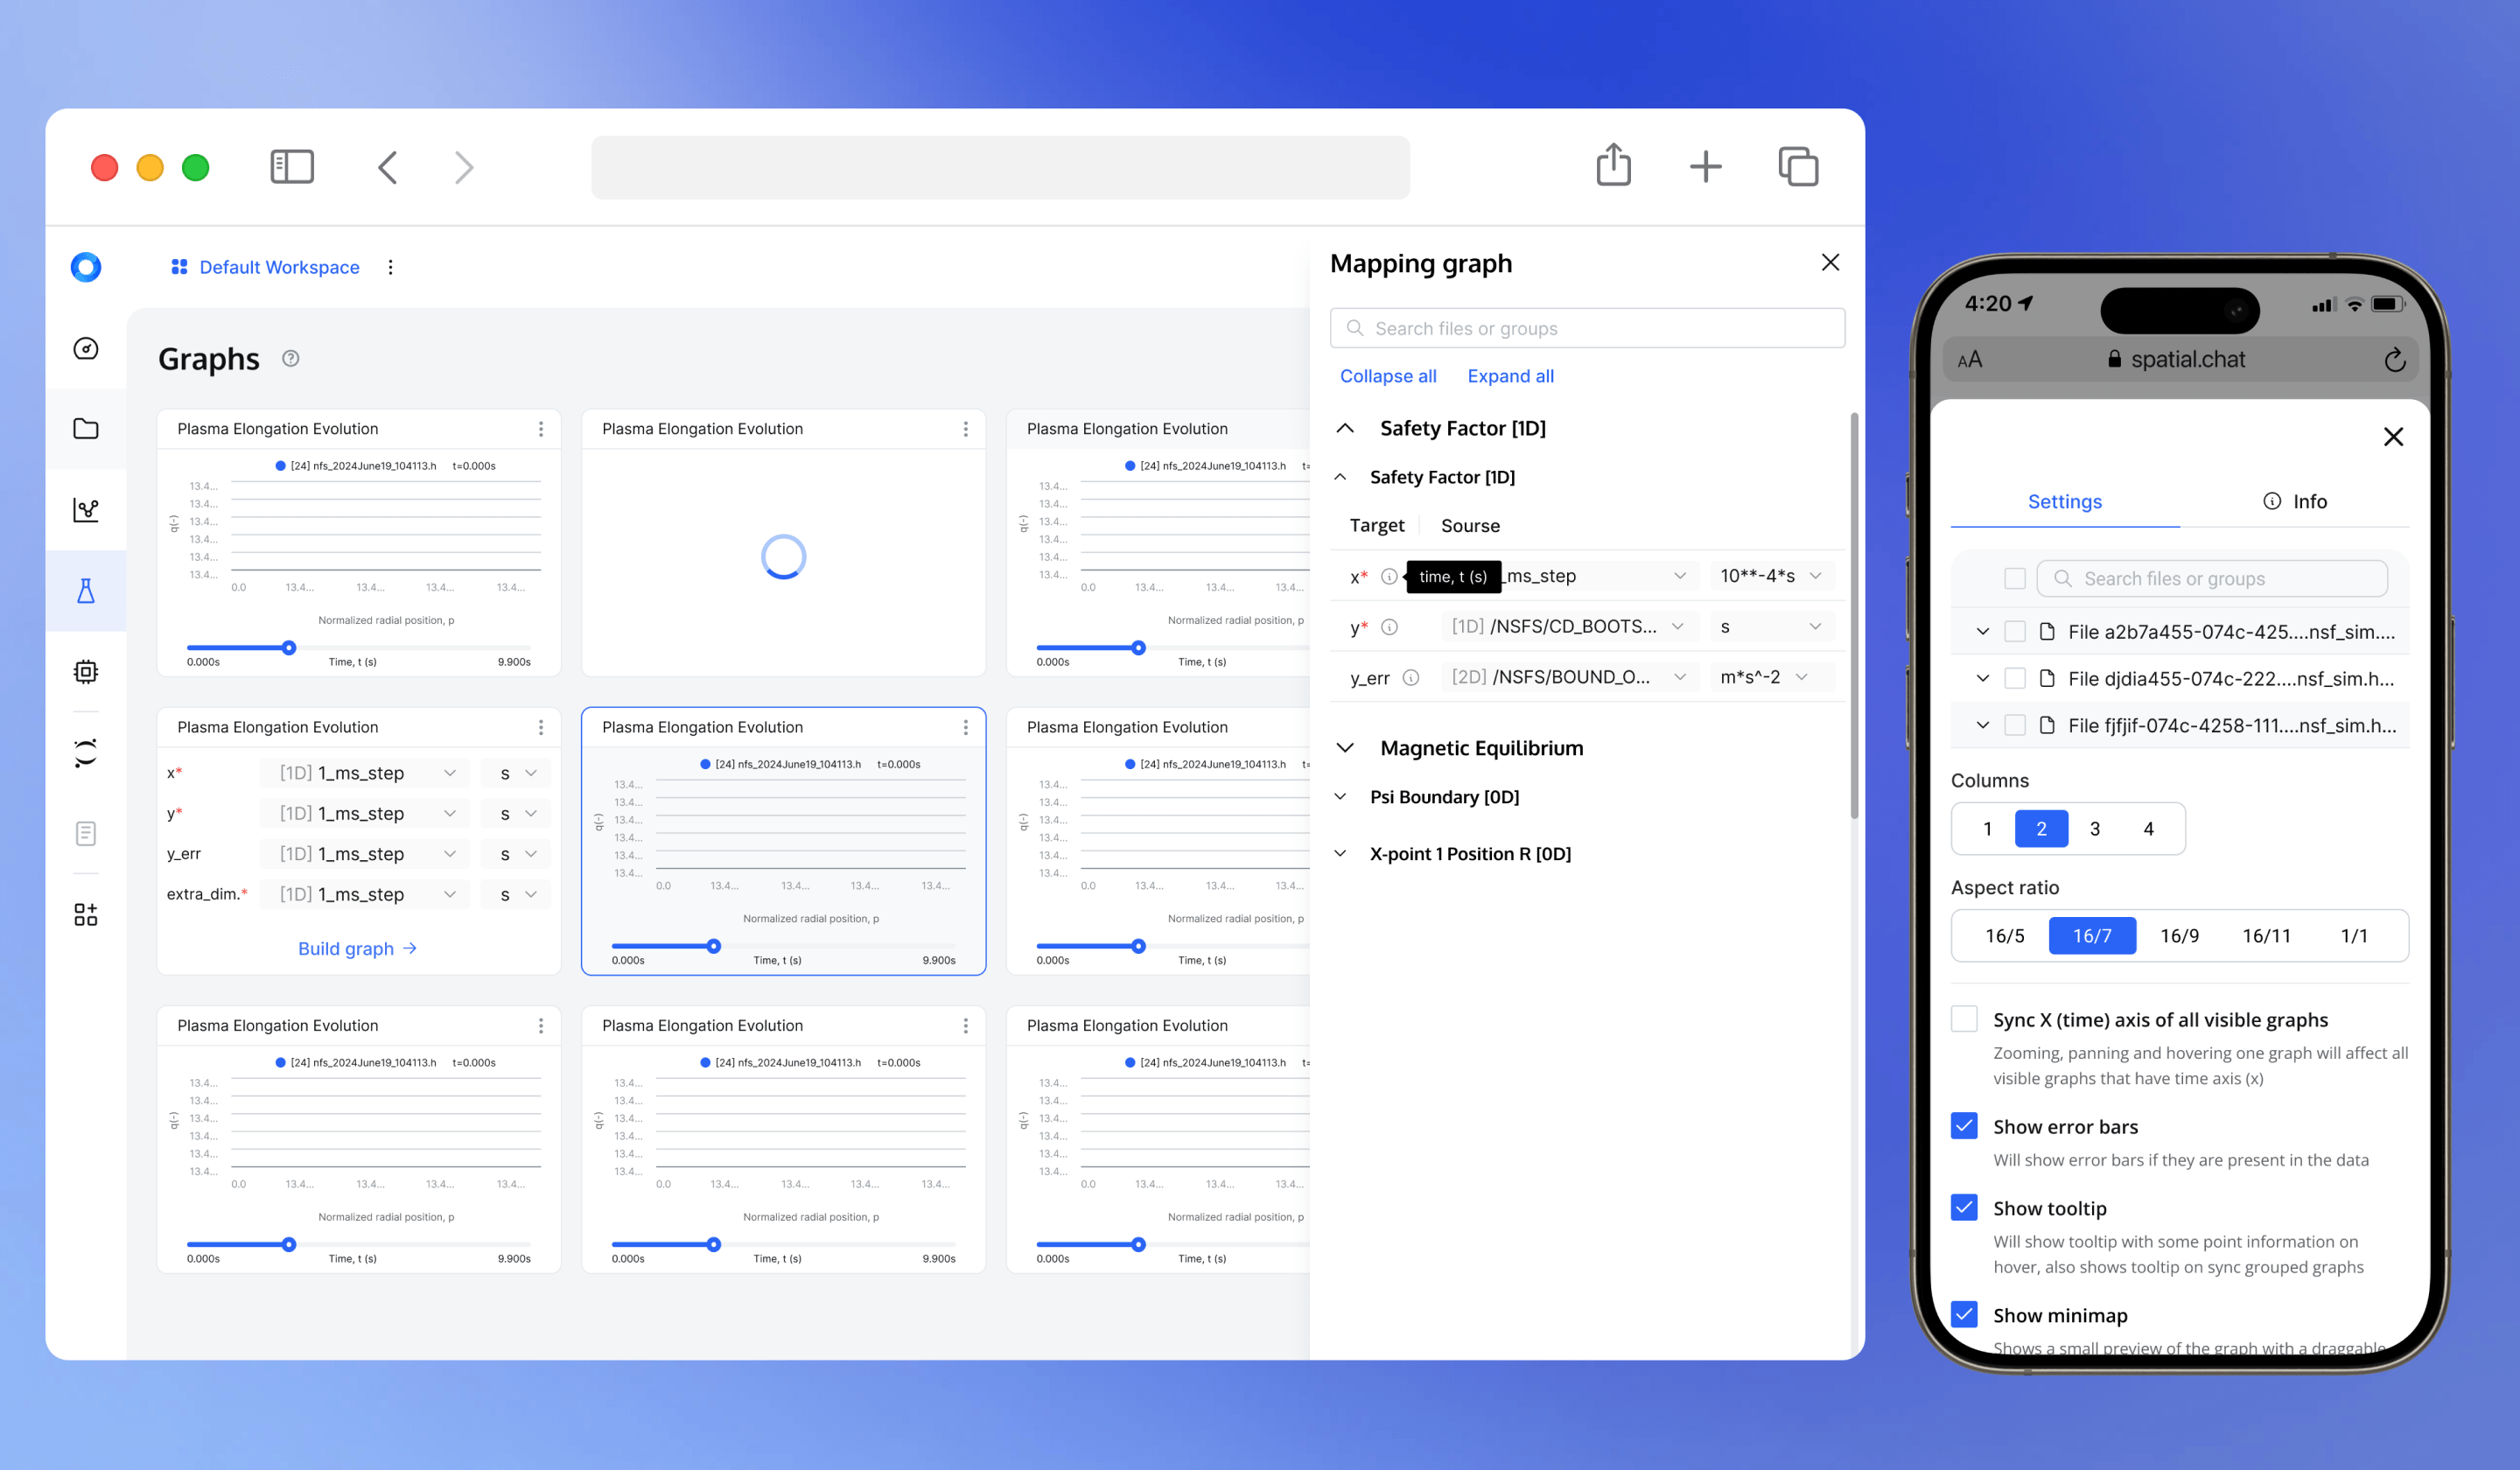
Parameter mapping makes relationships between files, parameters, and outputs visible and configurable before analysis.
Researchers needed to compare experimental data, simulation outputs, and multiple runs. Configurable chart layouts bring these datasets into one workspace, making differences easier to explore without switching between separate tools.
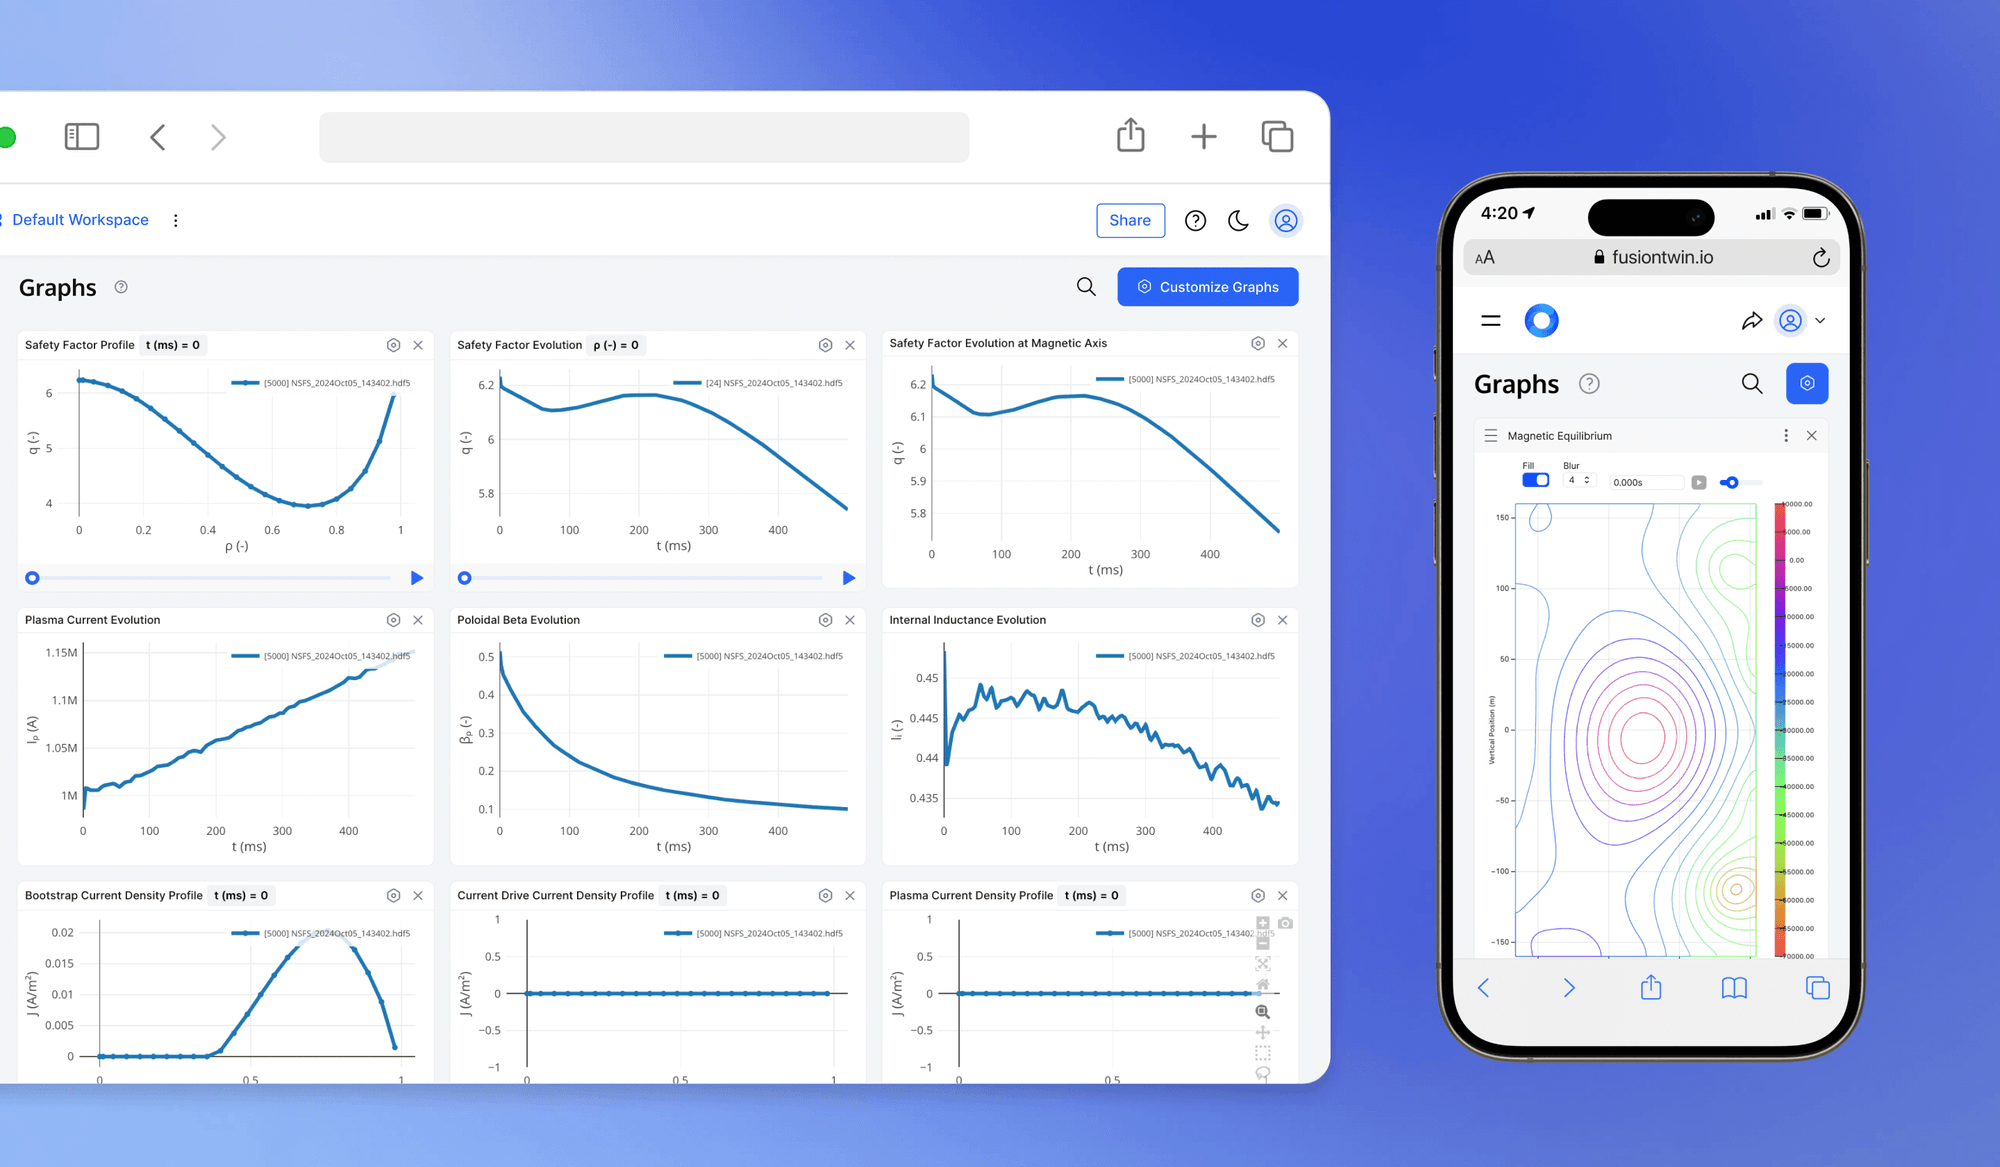
Hiding scientific information would undermine the work. I organized complexity instead: essential information appears first, while detailed data and deeper controls remain available when needed. This approach supports both quick orientation and thorough analysis.
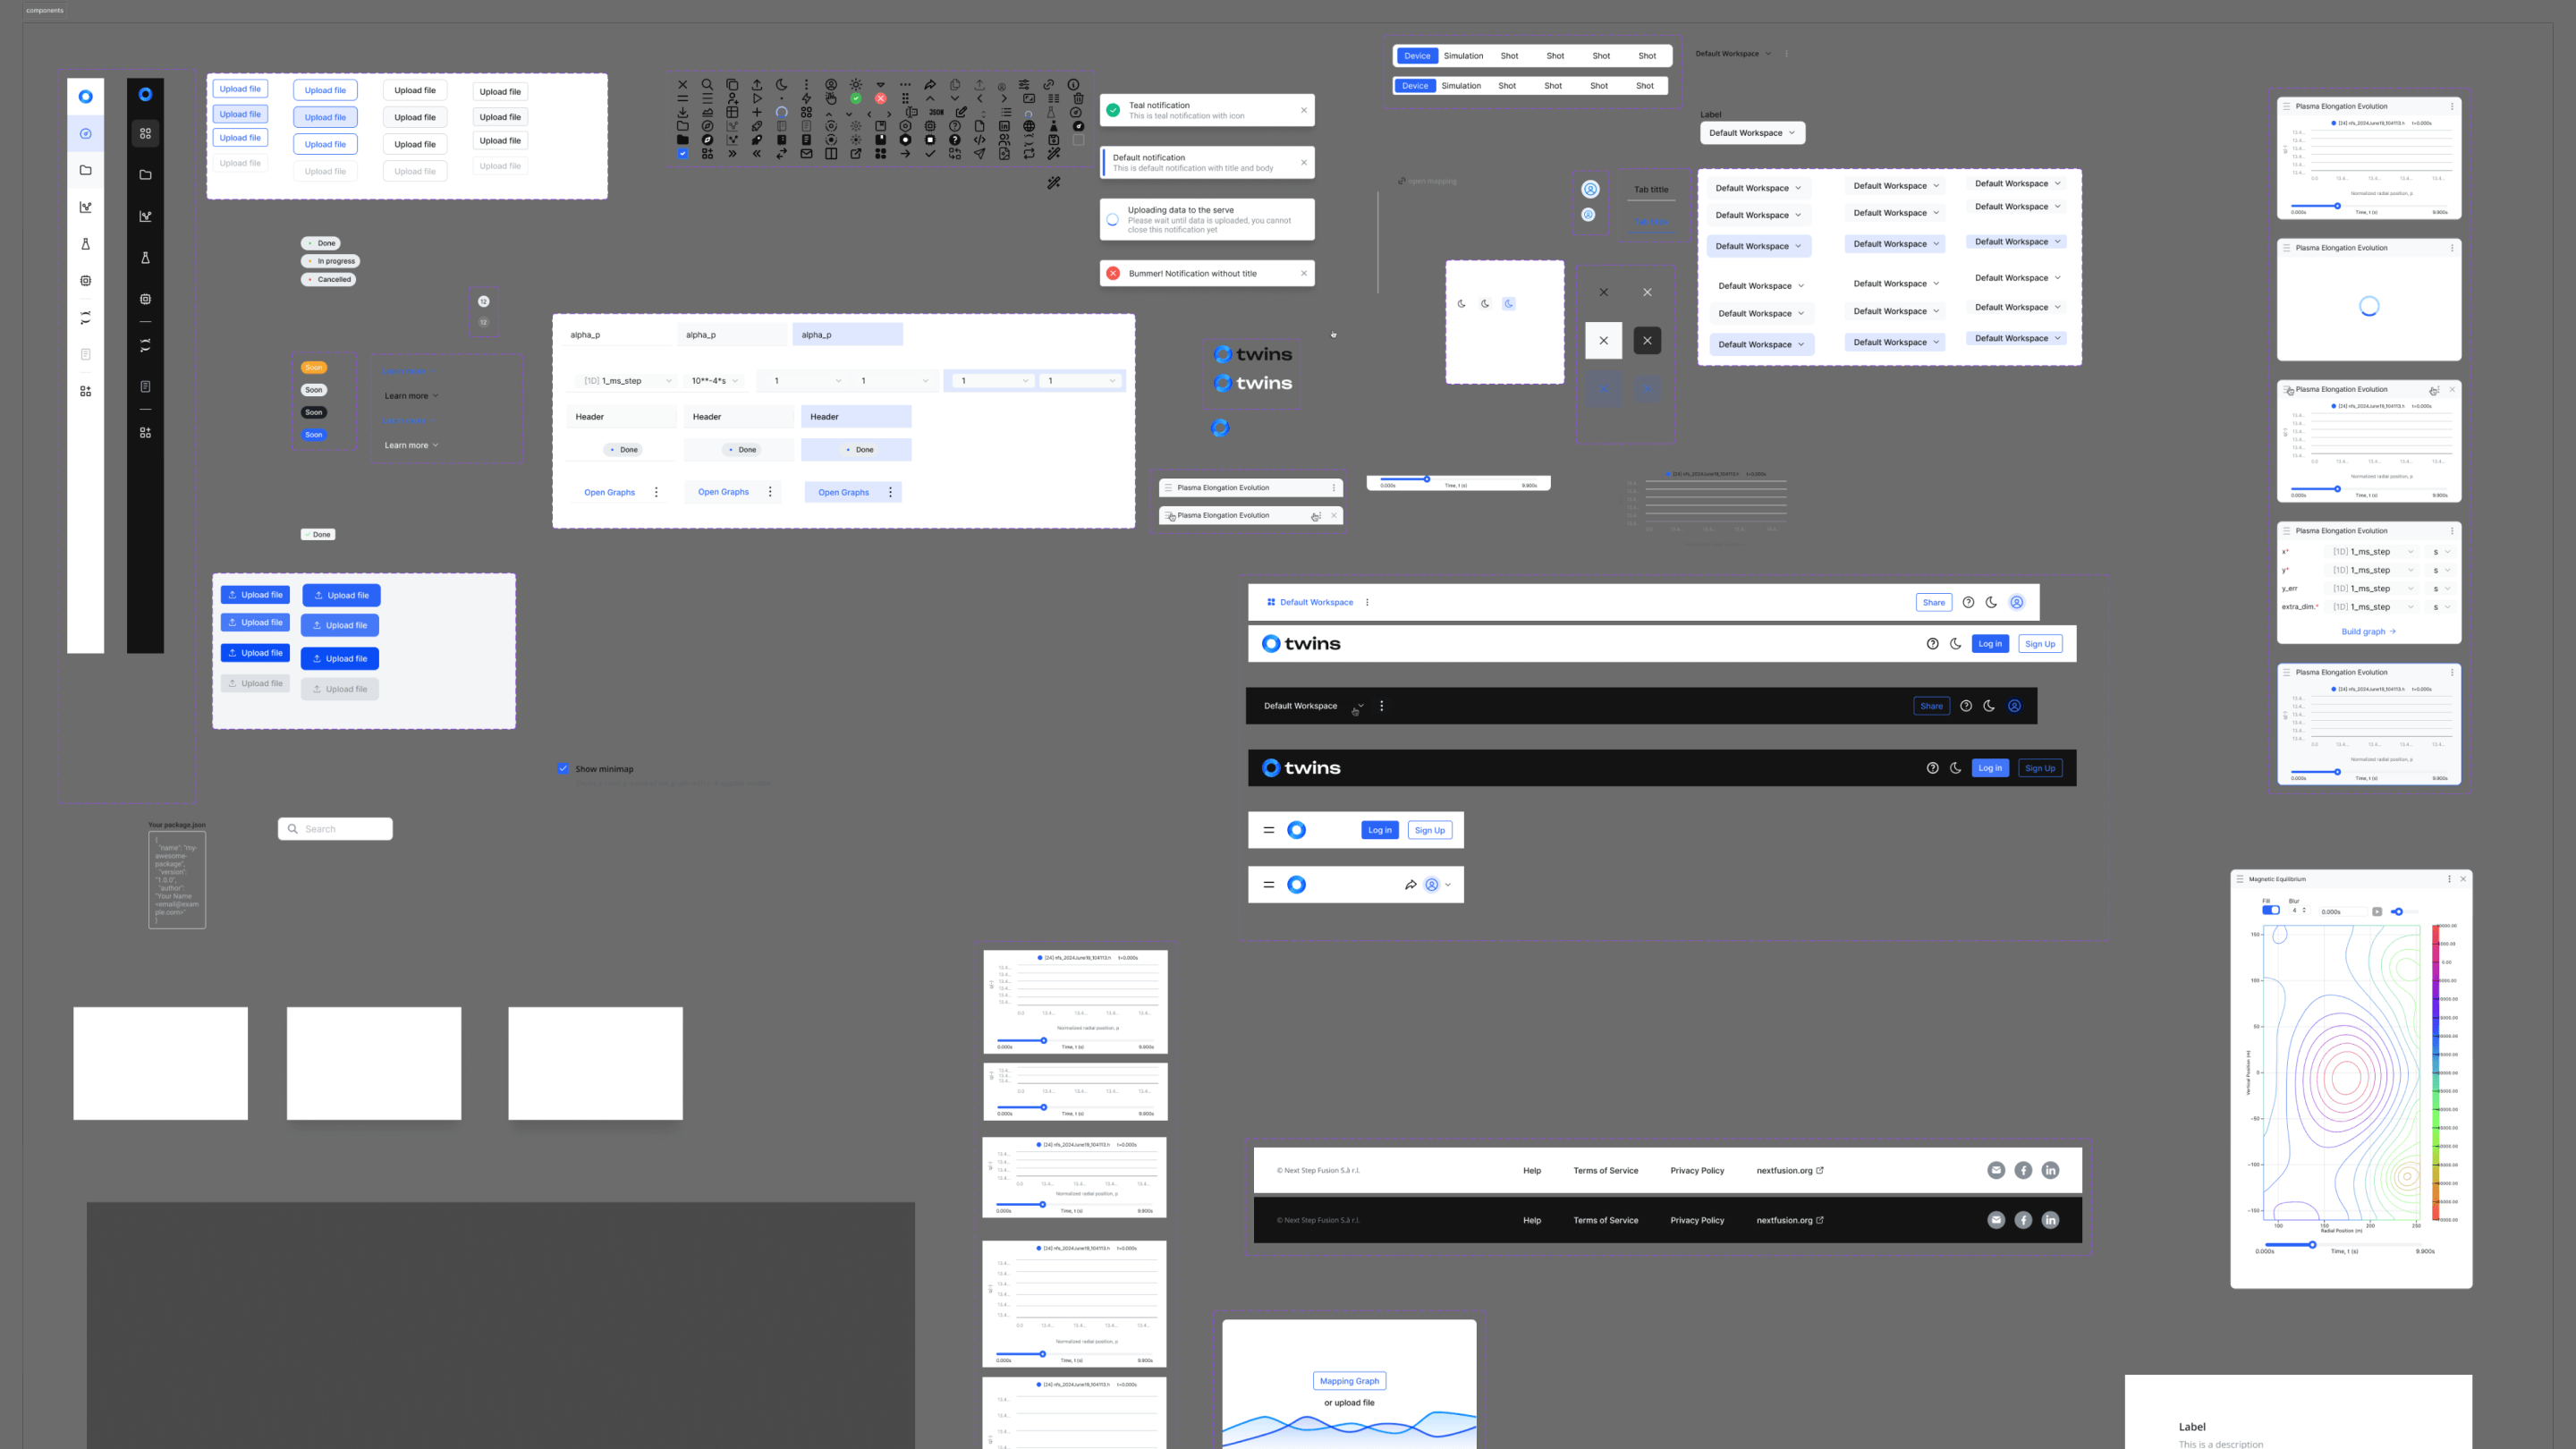
To support new scientific workflows, I created reusable patterns for:
Shared patterns gave design and development a consistent foundation.
Testing: around 30% better navigation efficiency across selected tasks.
One browser-based workflow connects files, simulation setup, parameter mapping, and results.
Reusable patterns support future workflows; browser access avoids complex local installation.
Fusion Twin taught me that a complex product does not always need to become simple.
The more useful question is: Which complexity belongs to the science — and which complexity is created by the tool?
Valeriia Bulgakova · © 2026