Challenge
Crowded navigation and inconsistent patterns limited usability and scale.
Redesigning credit and political risk insurance workflows.
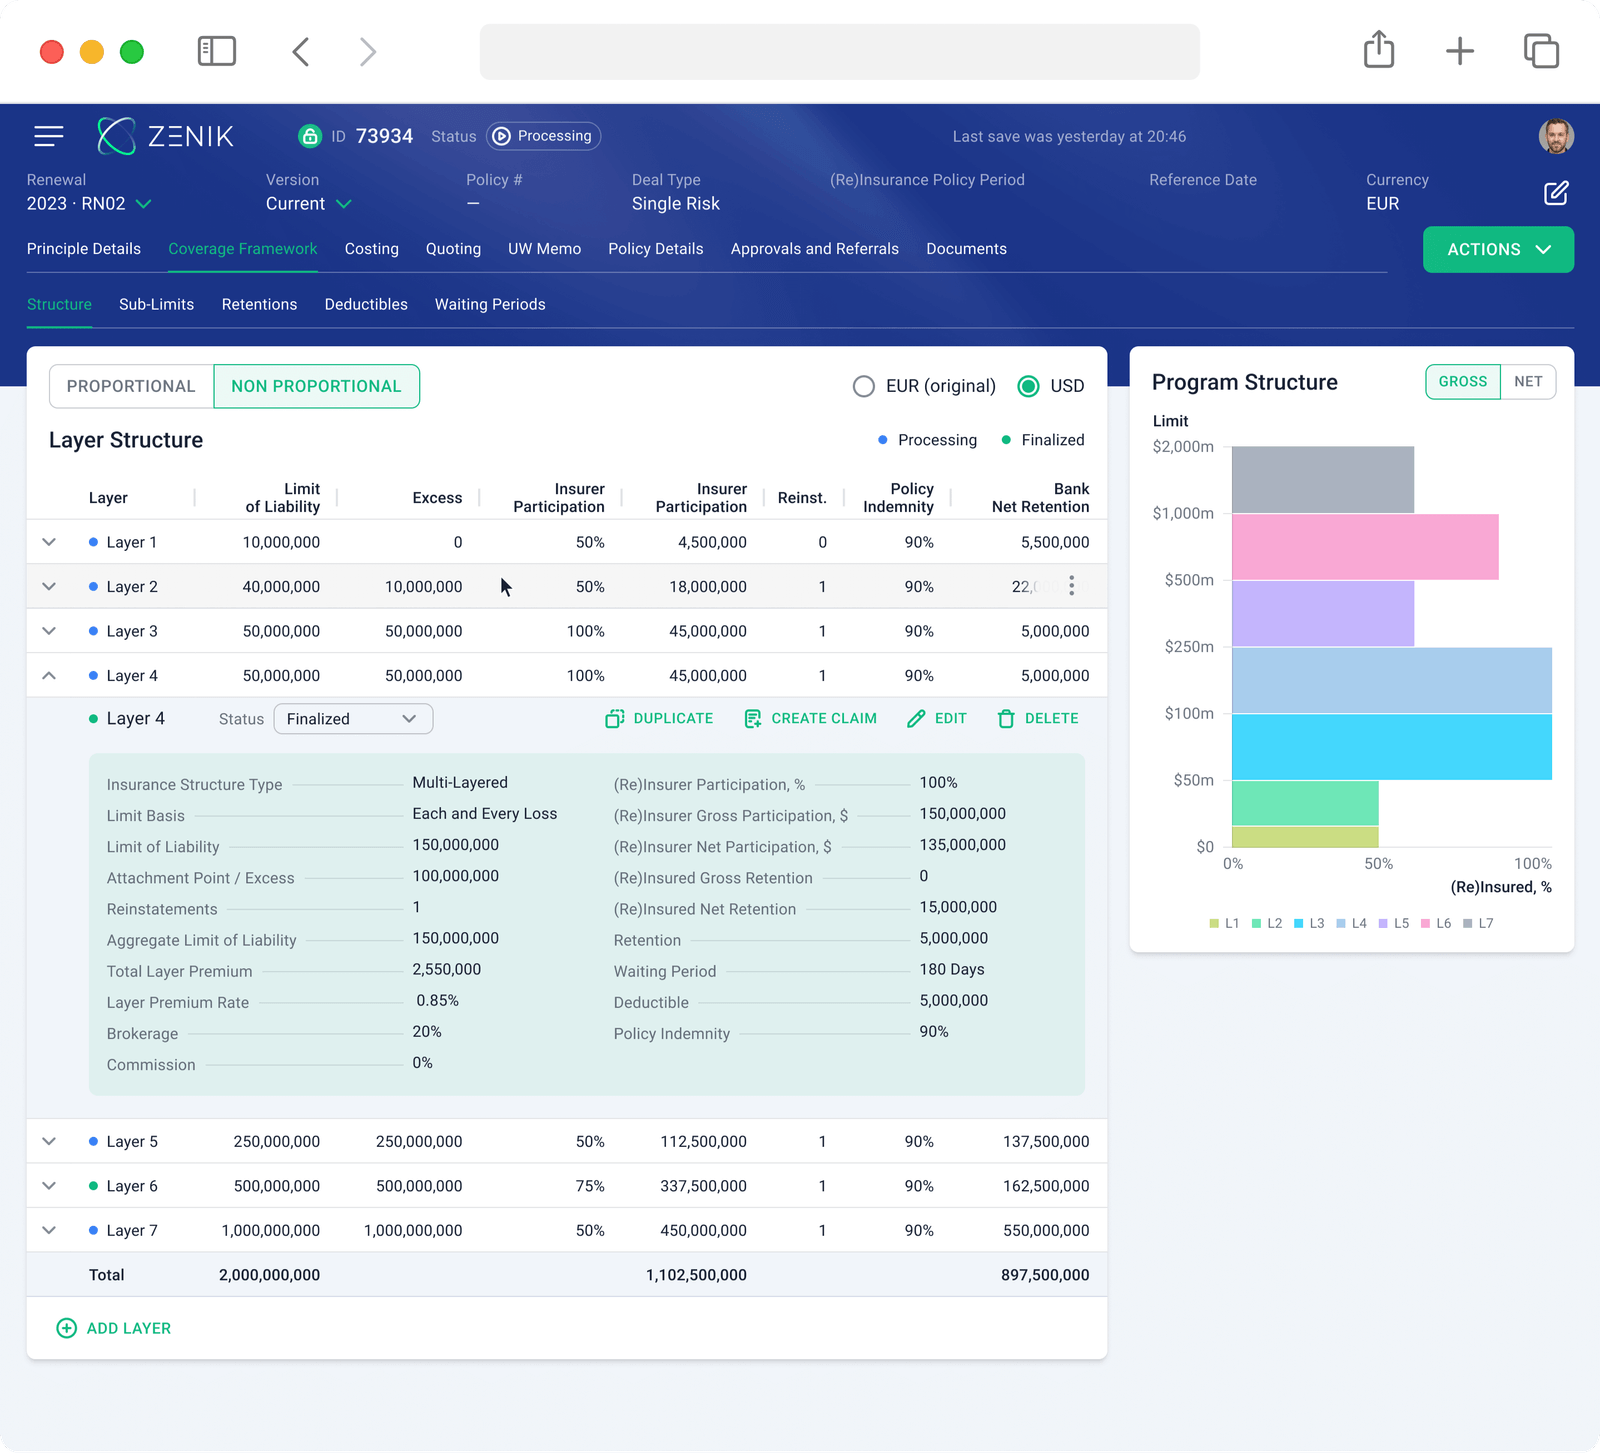
Crowded navigation and inconsistent patterns limited usability and scale.
Solo designer across research, architecture, UI, and handoff.
Reorganized navigation; built reusable risk, reporting, finance, and operations workflows.
Clearer structure and reusable patterns for future modules.
Users struggled to find tools and scan dense data.
Frequent tools were buried across modules.
Dense tables slowed comparison.
Controls and statuses varied between workflows.
Simplify navigation
Clarify data
Clarify status
Standardize interactions

I grouped overlapping destinations into a clearer, scalable structure.
Frequent tools were buried in the sidebar.
I regrouped destinations and added search, quick links, and breadcrumbs.
Clear module grouping
Search and quick links
Visible navigation context
Scalable structure
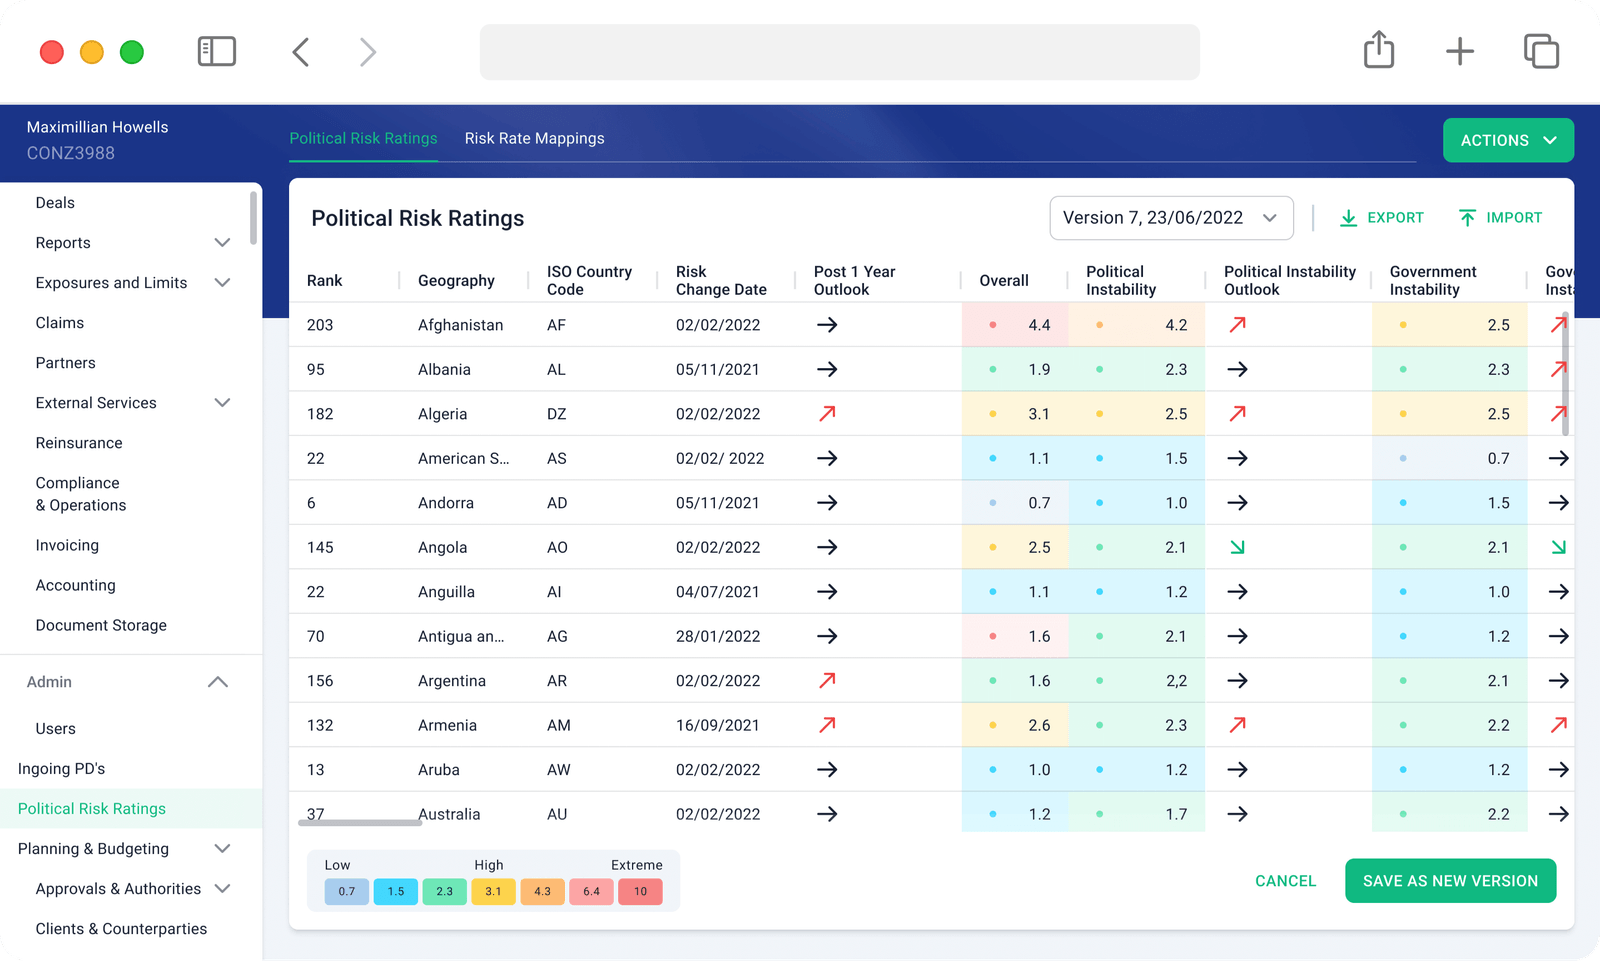
Related tools sit in expandable groups.
Ratings, trends, and data versions were hard to compare.
I clarified table hierarchy, risk scales, trends, and version controls.
Consistent risk scale
Visible data version
Scannable trends and ratings
Version-aware editing
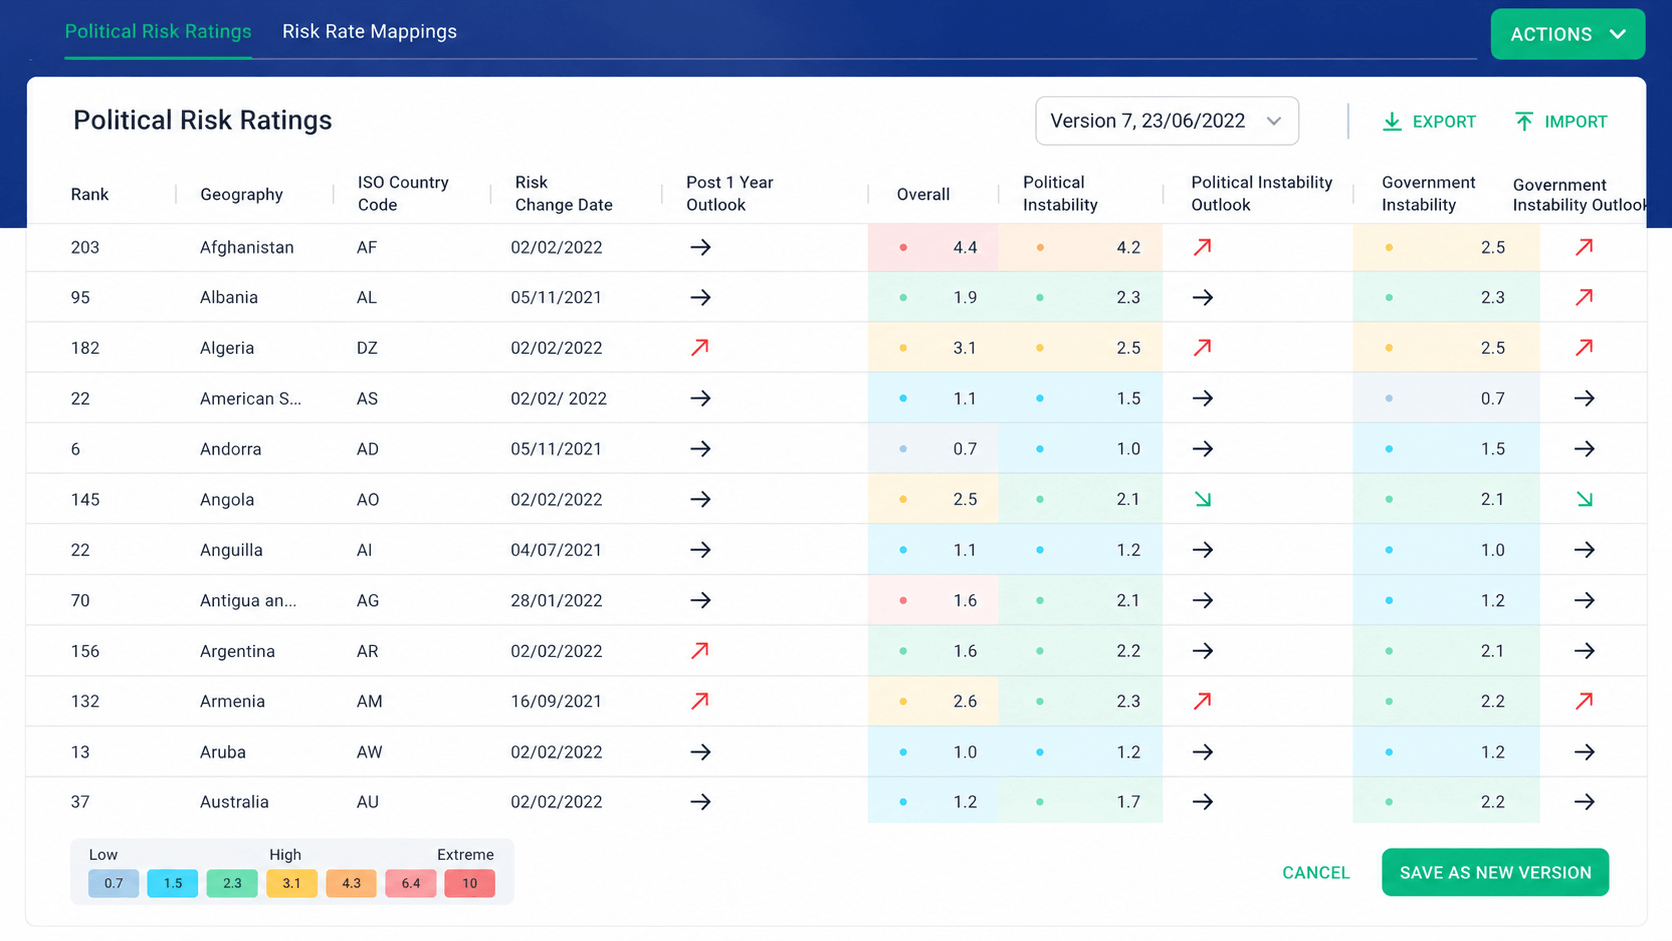
Users needed both summaries and detailed records.
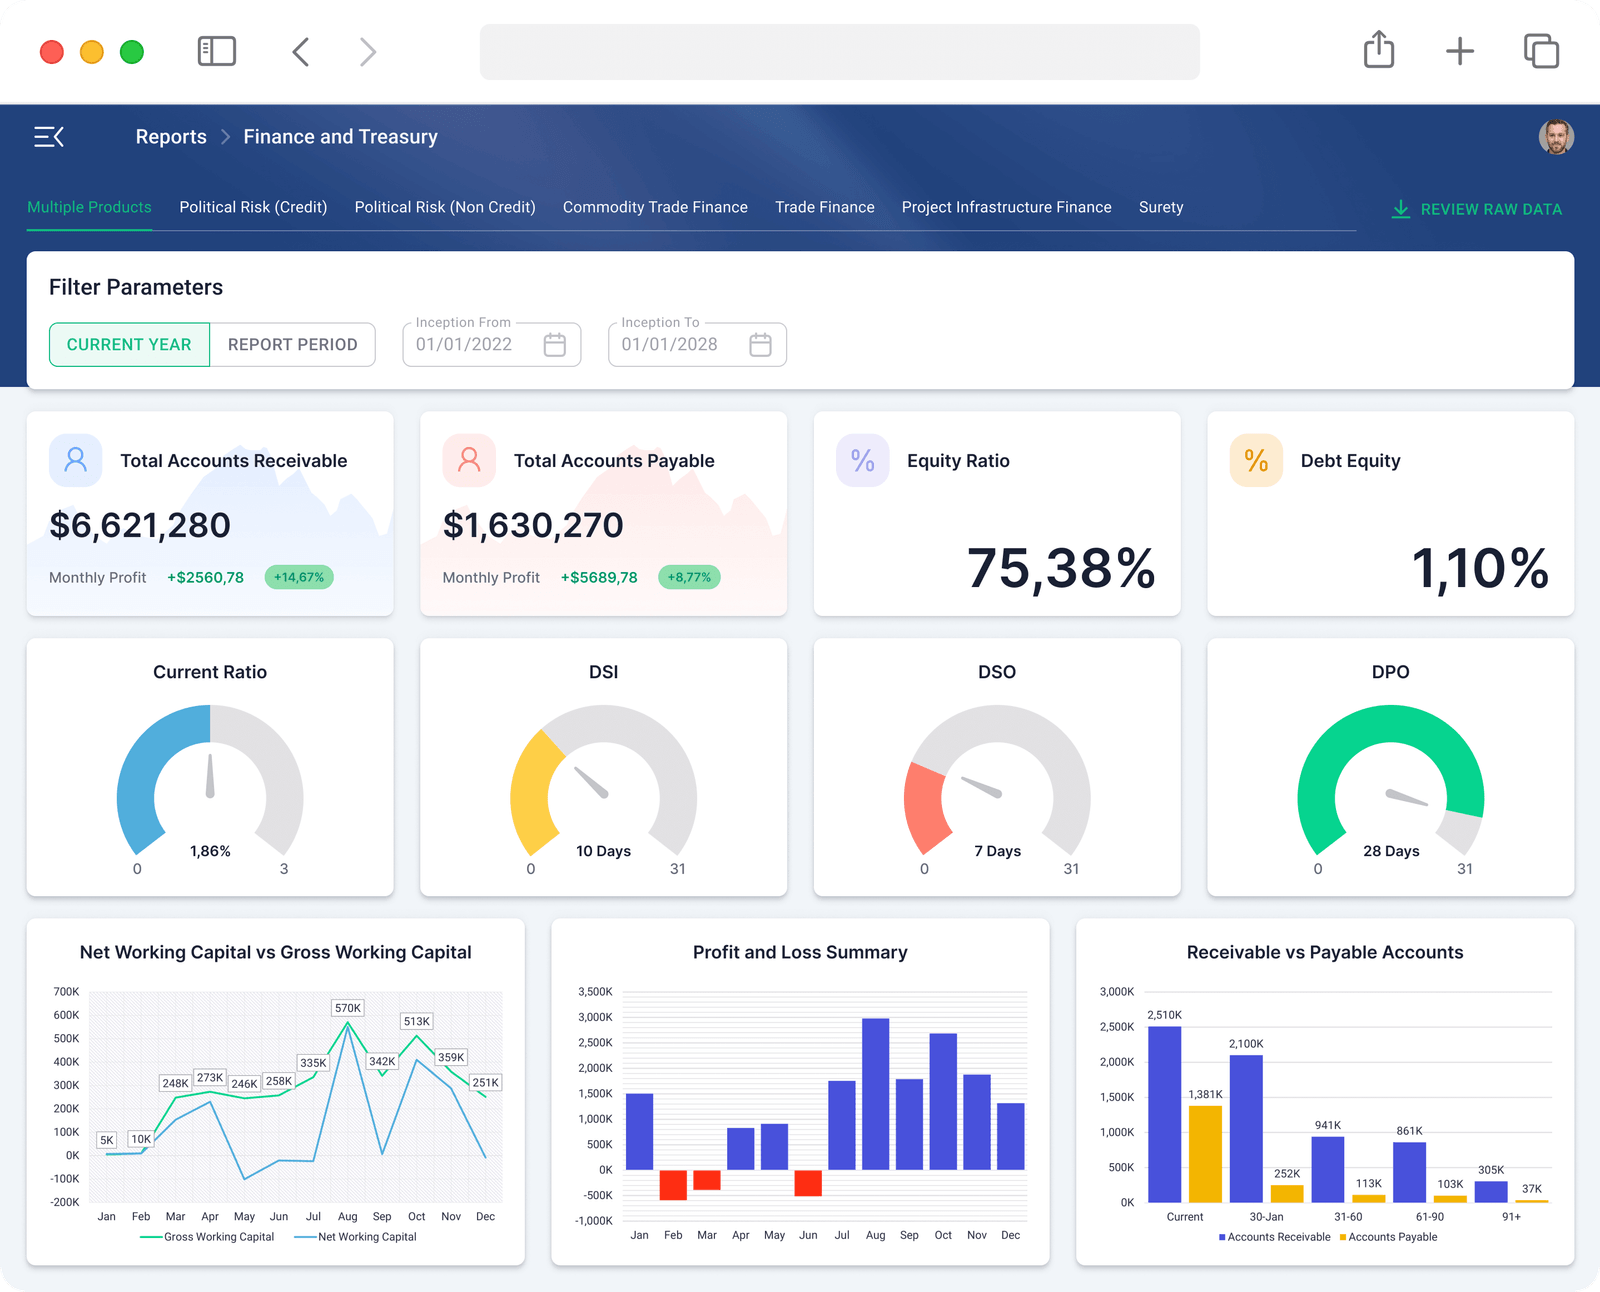
Parameters precede metrics and charts; expandable rows reveal details in place.
Filters before results
Clear KPI hierarchy
Expandable row details
Contextual actions
Filters lead to metrics and financial charts.
Expandable rows reveal details and actions in place.
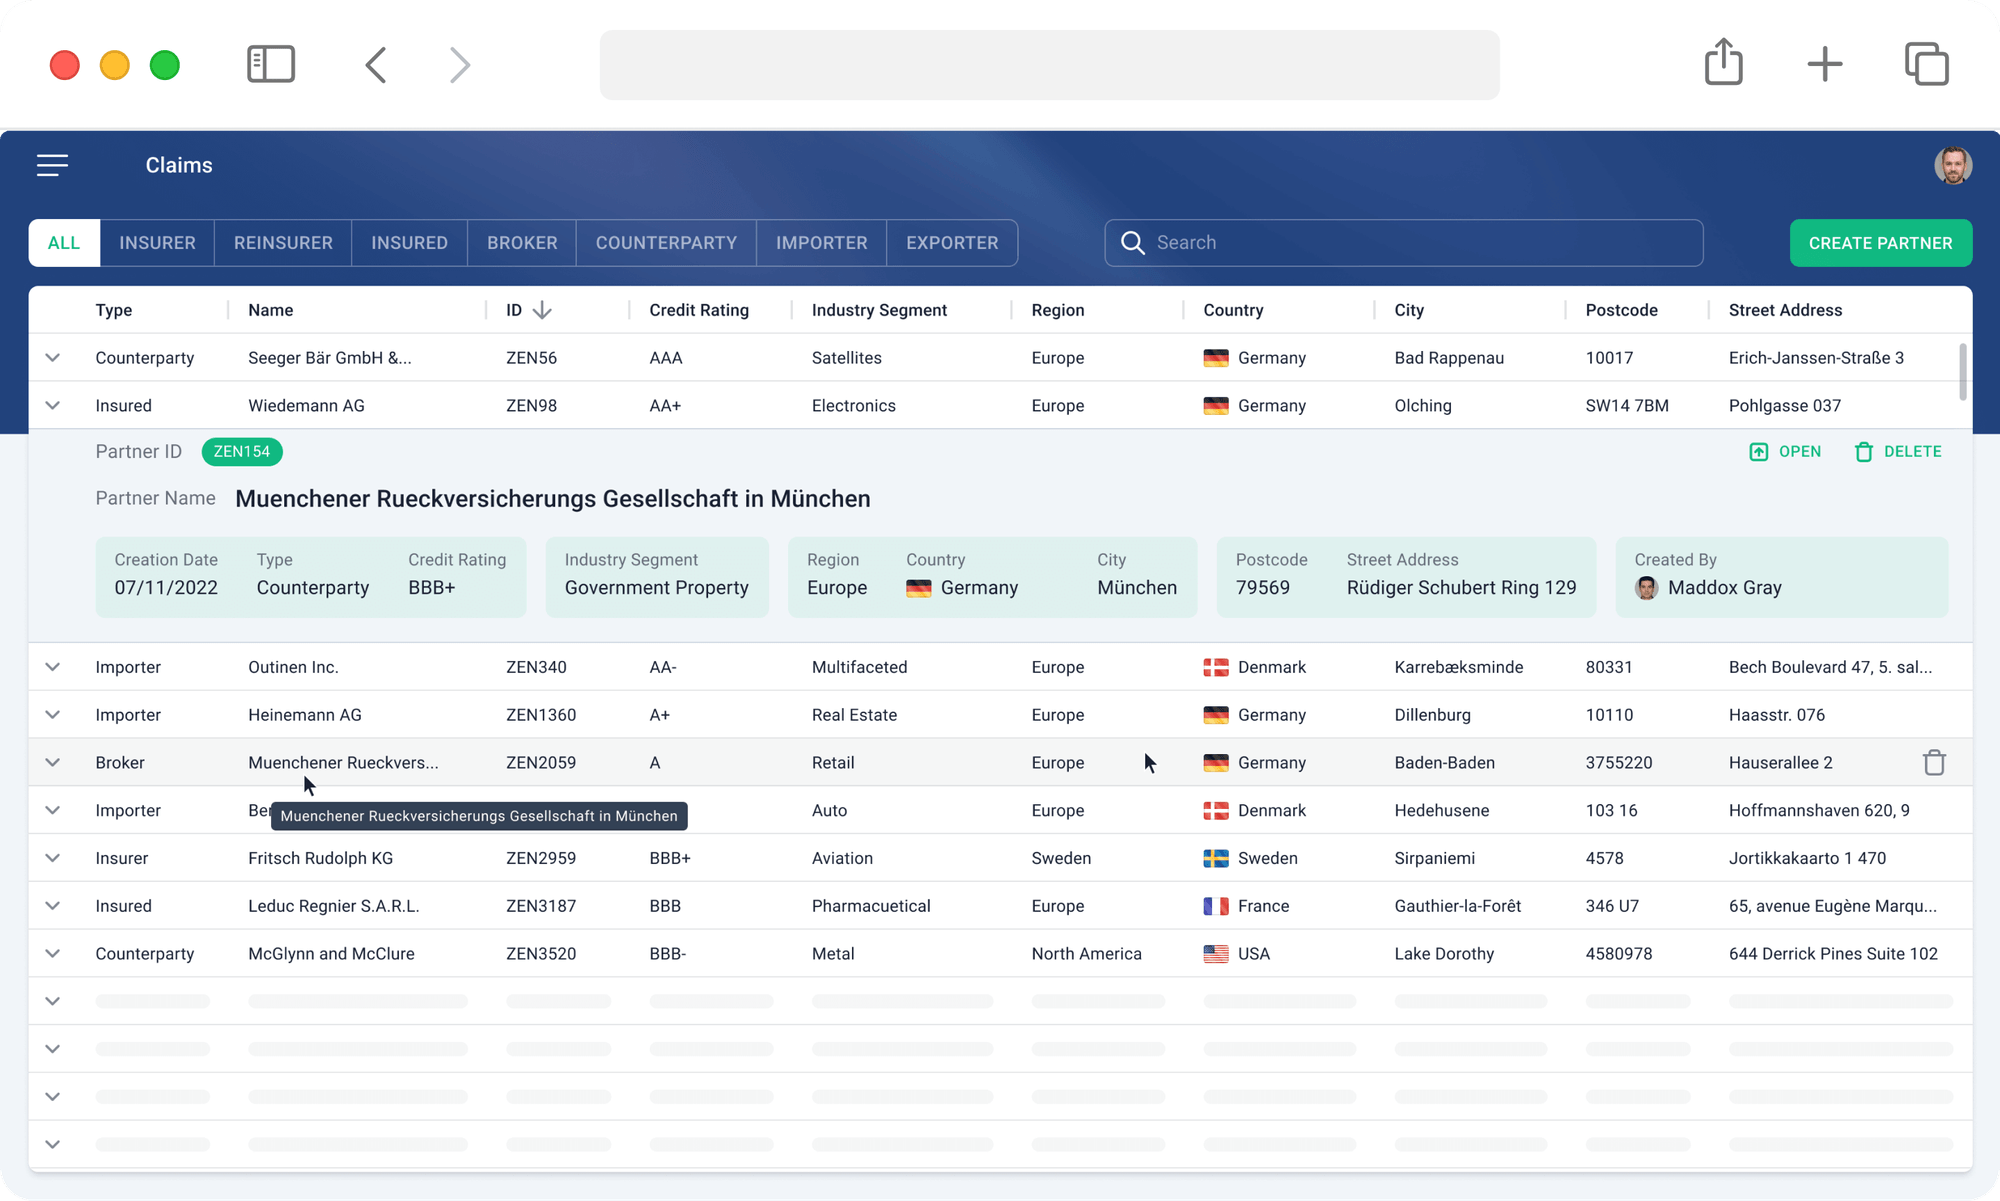
Shared navigation, tables, filters, forms, cards, and states support consistent module expansion.
Across selected core workflows.
Following navigation and interaction improvements.
Using reusable components and interactions.
Based on internal usability testing and delivery estimates.
The new foundation supported six core product areas, including Finance, Risk Ratings, Claims, and Approvals.
I learned that enterprise consistency depends as much on shared interaction rules as on visual tokens.
Valeriia Bulgakova · © 2026